 toomasv
commented
6 years ago
toomasv
commented
6 years ago Here are comparable stats from my W10:


Open hiiamboris opened 6 years ago
toomasv
commented
6 years ago Here are comparable stats from my W10:
 nedzadarek
commented
6 years ago
nedzadarek
commented
6 years ago It's late so I took only 1st test twice with waiting 1 and 4 seconds:
https://gist.github.com/nedzadarek/b2a73ccb6832b89456967be30df605bf
I'm on win 8.1 x64
In my opinion FPS is capped at 2^N but starting at 2^3(8).
FPS <= 8 are precise.
8FPS to more or less 14FPS have lost 1FPS.
2^4 (16) starts the pattern and it last to ~20FPS
=> From 22 to 30 FPS - it's irregular pattern. We need to inspect it more.
2^5 (32) & 2^6(64) are another patterns - FPS capped at 32 and 64 respectively. With those 2 checkpoints, you can see that (2^N)-4 to (2^N)-2 for N = 5 & 6 have sudden jump. I guess that sudden jump exist for 2^4(16) and 12 & 14 but I may overanalize it.
In my opinion the test should be more precise, especially for N<5. I mean count every FPS not every 2nd.
ps. for curiosity I tried 140 and it's still capped at 64.
 hiiamboris
commented
6 years ago
hiiamboris
commented
6 years ago Thanks, @nedzadarek ! Your data just follows that gathered by me and @toomasv. Never any progress at MS :)
 qtxie
commented
5 years ago
qtxie
commented
5 years ago Note also the strange artifact happening at rate ~60, resulting in ~37-38 FPS
IIRC, there is an issue about it. Yes. that's really strange as I cannot find any information online. No C/C++ (or other languages) programmers complain about it. So I suspect the problem is in our side, maybe we use the Timer API incorrectly?
hiiamboris
commented
5 years ago @qtxie the problem is WM_TIMER, as in reality it occurs only once every 15.4ms, as I've shown above.
 Oldes
commented
3 years ago
Oldes
commented
3 years ago This may be useful: https://www.codeproject.com/Articles/1236/Timers-Tutorial
hiiamboris
commented
2 years ago Data from another device (laptop, W10 x64).
| desired rate / mode |
55 fps |
|---|---|
| better battery | 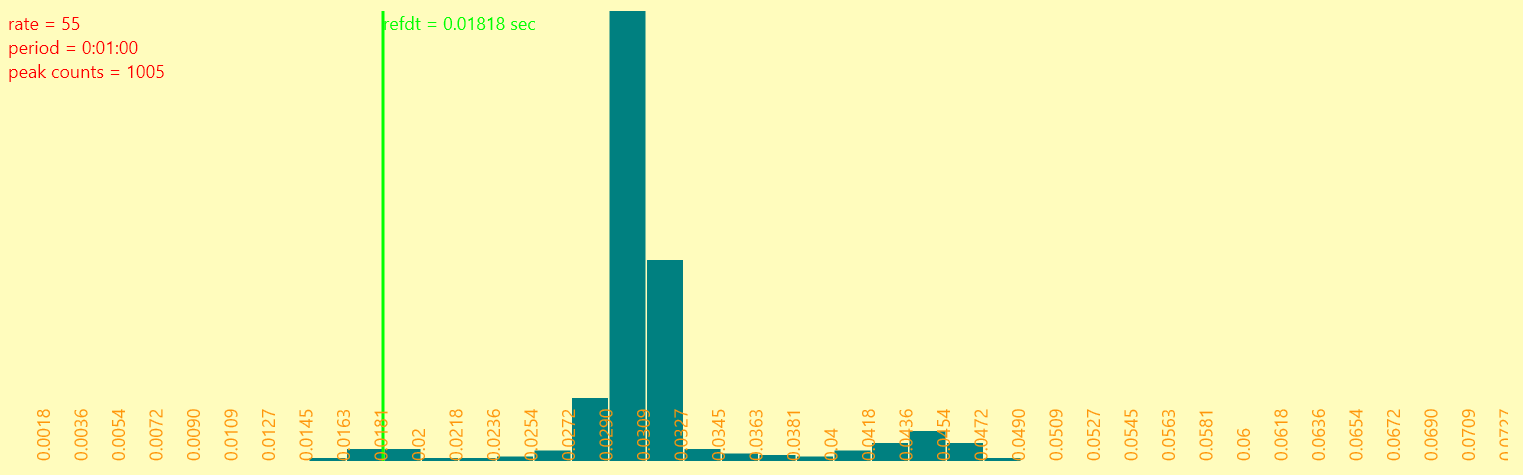 |
| max performance | 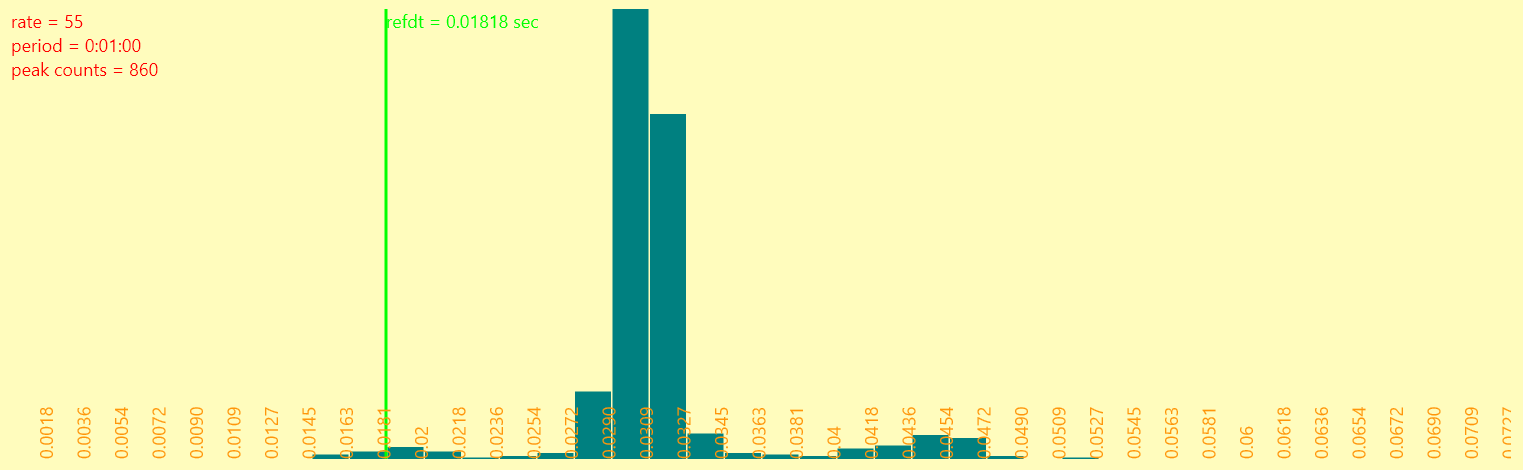 |
FPS curve: 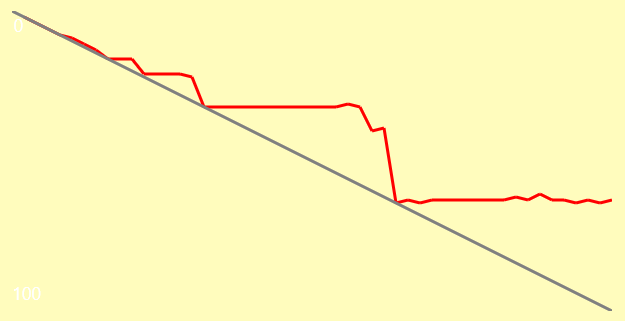
Now, on the same machine inside WSL2 running Ubuntu 20:
FPS curve: 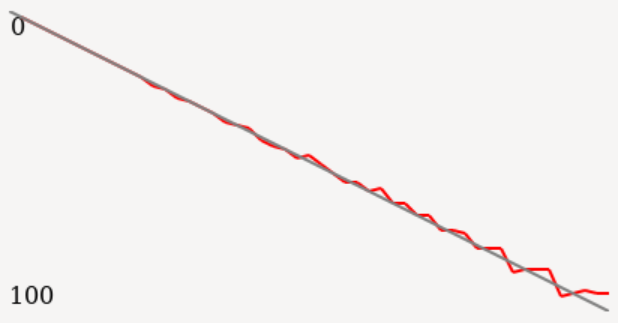
Histograms:
 (also tried in both battery modes - no difference)
So, data suggests it's not a common hardware but an OS issue. Also, I didn't register any elevation in CPU usage from Ubuntu during tests, so claims about heavier battery drain may turn out to be baseless.
 dockimbel
commented
2 years ago
dockimbel
commented
2 years ago @qtxie the problem is WM_TIMER, as in reality it occurs only once every 15.4ms, as I've shown above.
Correct, we used WM_TIMER message as a temporary implementation, that is not the way to achieve regular higher-precision time events.
hiiamboris
commented
1 year ago Just a related note. We're not using GetSystemTimePreciseAsFileTime in now/precise, because it's limited to W8+. But it boasts <1us precision, which would be nice to have. To support it we'll need to detect at runtime if it is supported by the OS and then load it conditionally and plug into now. Won't affect the FPS, but at least profiling precision.
dockimbel
commented
1 year ago We're not using GetSystemTimePreciseAsFileTime in now/precise, because it's limited to W8+.
We've dropped support for Win7, so we can move to that API.
EDIT: we already use that API for now/precise (it's actually your own code @hiiamboris), but I wonder where that 100ns accuracy went?
>> now/time/precise
== 23:43:45.8046
>> now/time/precise
== 23:43:52.9451
>> now/time/precise
== 23:43:53.6194You misread
GetSystemTimeAsFileTime
as
GetSystemTimePreciseAsFileTime
As for W7, one thing is letting some things break, another - not being able to run the exe because some import is missing. I vote against that.
qtxie
commented
1 year ago You misread
GetSystemTimeAsFileTimeasGetSystemTimePreciseAsFileTimeAs for W7, one thing is letting some things break, another - not being able to run the exe because some import is missing. I vote against that.
We can use GetProcAddress to load those functions.
dockimbel
commented
1 year ago You are welcome to send a PR modifying your own code to use GetSystemTimePreciseAsFileTime().
I've been poking around Windows animation lag and wanna share the results. This only concerns animation achieved via the use of
ratefacet, and can likely be avoided viado-events/no-waitrunning in a custom loop.TLDR: Currently the FPS is capped at 65 and can only equal the integer fractions of 65: 65, 32, 21, 16, 13, 10 and lower. Moreover the frame lag is somewhat jumpy. This has to improve ☺
Here's a typical correspondence plot between the desired
ratefacet of a face and the FPS it produces:From top to bottom is the measured FPS (0 to 100), from left to right is the value of
ratefacet (1 to 100). Gray is the desired line, red is what actually happens. Note also the strange artifact happening at rate ~60, resulting in ~37-38 FPS.As you can see there are steps on the plot. The steps values are fractions of 65, which indicates that
on-timeevent happens on the margins of1000 / 65 = 15.4ms.Currently Red implements
on-timeviaSetTimerwinapi call that pushes the WM_TIMER messages into the thread's window message queue..SetTimeris theoretically capped at 100 FPS:0xA = 10 ms = 100 fps. On practice however, as shown before, even this is never reached.
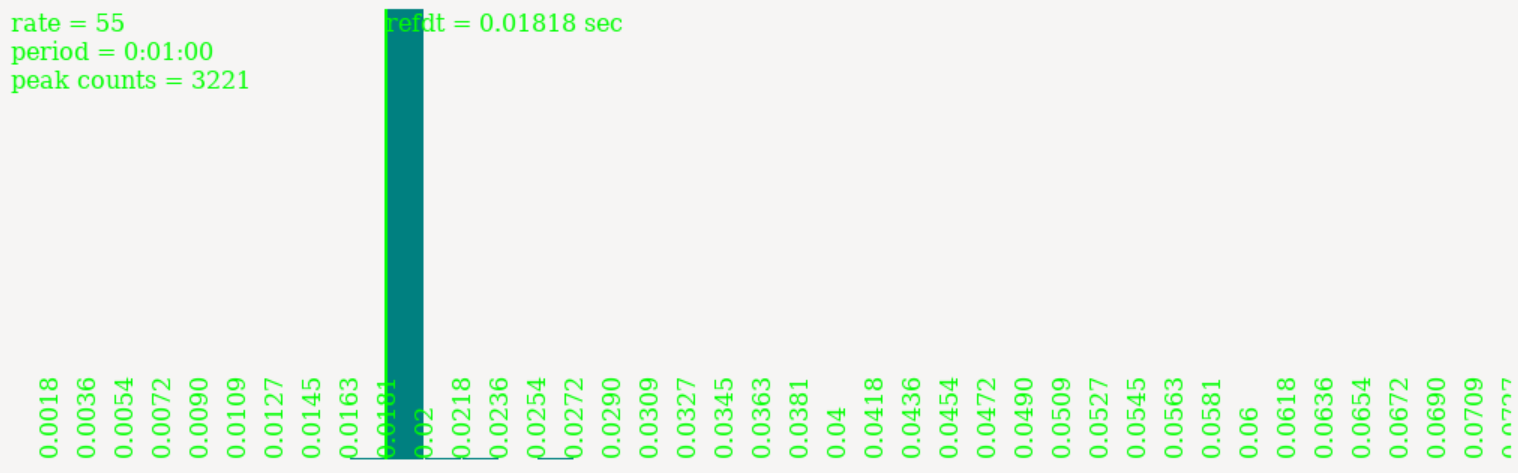
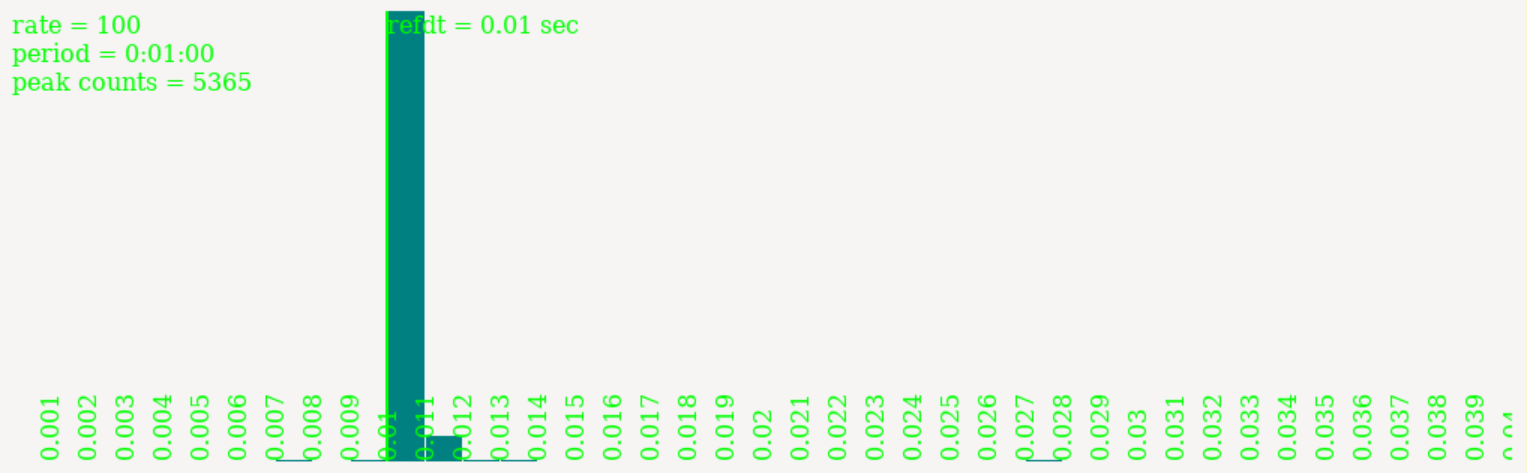
Moreover, here's some histograms of inter-frame time for a few
ratevalues:refdtdenotes a reference time between frames, which should ideally be obtained for a given rate. At rate 100 it is scattered between 10ms and 20ms.Solutions
I'll just draft a few ideas. Someone with better knowledge of Red internals, and multimedia programming expertise might provide better insights and be able to implement this.
check+wait
I would myself give up the timers and go for a simpler algorithm:
With this approach both 1000 FPS and 100% CPU core load should be achievable, while it's also very simple. Also it's system-independent.
multimedia timers
If timers are the way to go, there are better timers than
SetTimer.timeSetEventallows 1ms resolution timers to be set. When given aTIME_CALLBACK_EVENT_PULSEvalue it will pulse an event object.MsgWaitForMultipleObjectsmay be used to wait for both: timer event and WM* events coming to the window, thus preserving the synchronous behavior of event operations. If a callback function was used instead of the system event, I expecton-timewould be able to fire in the midst of other Red code being executed, undesirably.Same 1000 FPS and 100% CPU core load should be achievable.
Notes
The info was gathered on W7 x64. Users of other versions might provide more info by running these tests:
measure the rate/fps curve
Change
ptsto choose how many points on the plot you want. Each takes 1 sec to measure.measure the time between frames
periodcontrols how long to run the testrate- obviouscell- how many columns the histogram should be divided upon