 iliassaek
commented
3 years ago
iliassaek
commented
3 years ago Hello @derekakelly , I had the same error when I used Grafana 6.7.2, I resolved the parse issue by upgrading grafana to version 7.5.7.
Closed derekakelly closed 2 years ago
iliassaek
commented
3 years ago Hello @derekakelly , I had the same error when I used Grafana 6.7.2, I resolved the parse issue by upgrading grafana to version 7.5.7.
 bjolivot
commented
3 years ago
bjolivot
commented
3 years ago the problem for grafana6 is the use of $__rate_interval, only availlable in grafana 7+
As a workaround, you can edit the json source and replace :
10 second in notepad++ :
open the json file use the replace function with regex : search: rate((.*)\$__rate_interval replace by: irate(${1}5m
copy the json to grafana and enjoy this great dashboard (thank you @rfrail3 👍 )
 yezooz
commented
3 years ago
yezooz
commented
3 years ago @bjolivot : $__rate_interval -> $__interval will do the job, if you want to keep the interval configurable.
 p6002
commented
2 years ago
p6002
commented
2 years ago Any way how to fix it in new Grafana?
 tadavid-cae
commented
1 year ago
tadavid-cae
commented
1 year ago any fix for grafana/grafana-oss:9.2.6?
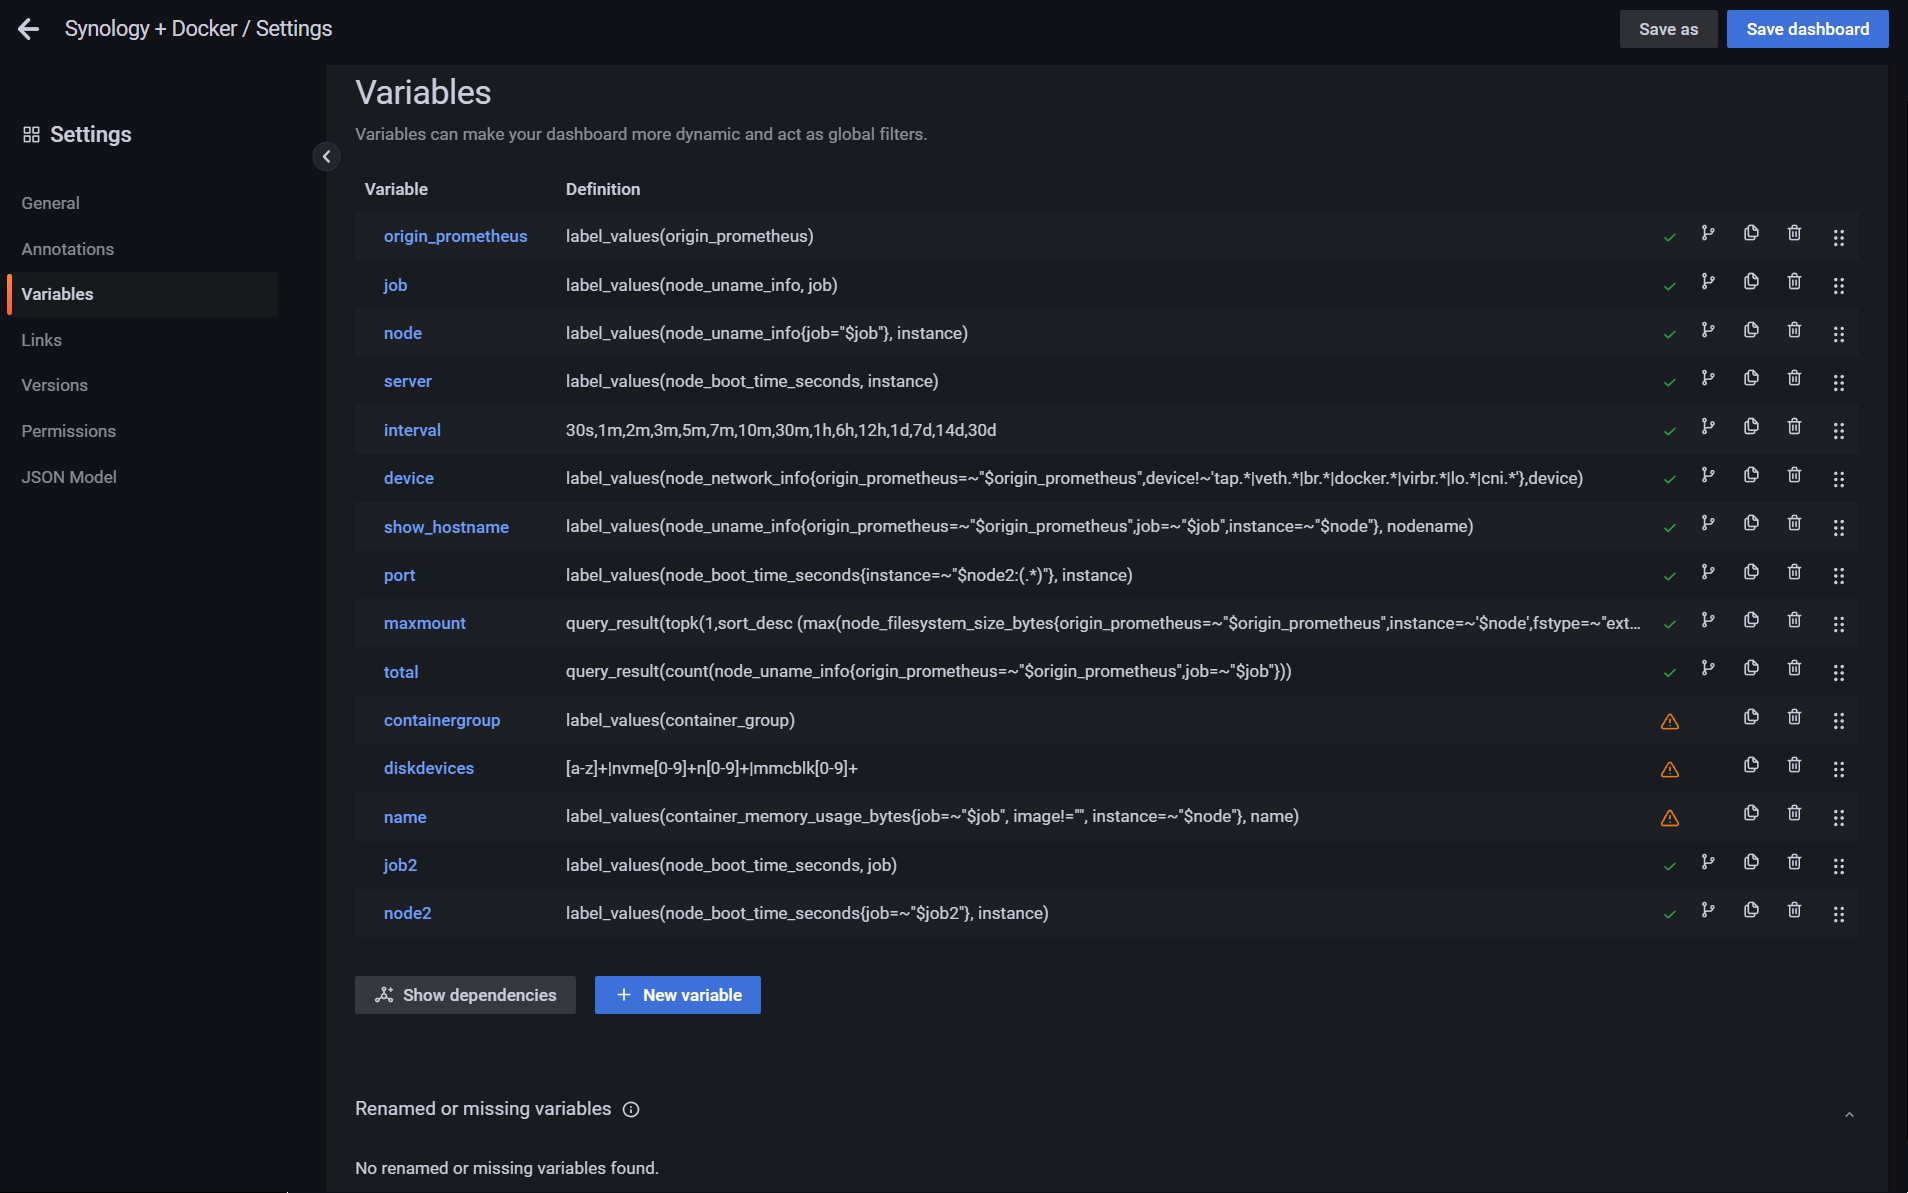
p6002
commented
1 year ago From what I've found online, these are the wrong Variables. Go into settings/variables and they should all be with a green checkmark, and the missing ones will show up if you click the link at the bottom.
What I did was that I found a partially working dashboard, added the necessary panels from other dashboards to it and copied variables from them.
Some variables are repeated, such as job or node. Then I rename the variable to job2 and node2 in the dashboard settings and later in editing the panel, replace $job with $job 2 in the code and everything works.
Here a sample code:
node_memory_MemFree_bytes{job="$job2",instance=~"$node2:$port",job=~"$job2"}
Original code:
node_memory_MemFree_bytes{job="$job",instance=~"$node:$port",job=~"$job"}
https://i.ibb.co/nLvysYy/Zrzut-ekranu-20221206-172250.png
https://i.ibb.co/Kx0dP3h/Zrzut-ekranu-20221206-172325.png
https://i.ibb.co/MhHc75M/Zrzut-ekranu-20221206-172339.png
Node-exporter for server stats, cAdvisor for docker stats, Prometheus for storing data, Grafana to visualize it.
Hello, About half of the sections are coming up like this.
I'm using Ubuntu 21.04, with Prometheus version 2.22.0+ds-1, and prometheus-node-exporter version 1.1.0+ds-2. Both installed with apt. I have Grafana version 6.7.4, installed with snap.
I had this dashboard working on another install, but it's fighting me a bit here.