 rm-hull
commented
7 years ago
rm-hull
commented
7 years ago Can you paste the program you have written into the comments box on this issue?
Closed timwareing closed 6 years ago
rm-hull
commented
7 years ago Can you paste the program you have written into the comments box on this issue?
 timwareing
commented
7 years ago
timwareing
commented
7 years ago I've cut the program down to this sample. If you need more please let me know.
#!usr/bin/env python

import time
import re
import argparse

from luma.led_matrix.device import max7219
from luma.core.interface.serial import spi, noop
from luma.core.render import canvas
from luma.core.virtual import viewport
from luma.core.legacy import text, show_message
from luma.core.legacy.font import proportional, CP437_FONT, TINY_FONT, SINCLAIR_FONT, LCD_FONT

print('Press Ctrl-C to quit...')

serial = spi(port=0, device=0, gpio=noop())
device = max7219(serial, cascaded=5, block_orientation=0)

currentLoop=0

if __name__ == "__main__":
    parser = argparse.ArgumentParser(description='matrix_demo arguments',
        formatter_class=argparse.ArgumentDefaultsHelpFormatter)

    parser.add_argument('--cascaded', '-n', type=int, default=5, help='Number of cascaded MAX7219 LED matrices')
    parser.add_argument('--block-orientation', type=int, default=0, choices=[0, 90, -90], help='Corrects block orientation when wired vertically')

    args = parser.parse_args()

    while True:

        currentLoop = currentLoop + 1

        Tv = str(currentLoop)
        Tv = Tv.rjust(5," ")

        with canvas(device) as draw:
            text(draw, (0, 0), Tv, fill="white")
            print ("%d") % (currentLoop)
            time.sleep(1)

            if currentLoop>=99999:
                currentLoop=0
Thanks, I've just formatted your answer slightly.
Is there a particular value of currentLoop where it starts to go corrupt ?
The only observation I have at the moment would be to move code unrelated to the LED outside of the with statement, and print the Tv value rather than currentLoop so it would look like:
    while True:

        currentLoop = currentLoop + 1

        Tv = str(currentLoop)
        Tv = Tv.rjust(5," ")

        with canvas(device) as draw:
            text(draw, (0, 0), Tv, fill="white")

        print(Tv)
        time.sleep(1)

        if currentLoop>=99999:
            currentLoop=0
But I shall set up a RPi and 5 LED matrixes and see if I can reproduce.
timwareing
commented
7 years ago Hi
I'm trying to test it now. It's around 5 hours use. So it's difficult to know exactly when it goes wrong
The original program outputs a value from a sensor. So in the version you have I have removed all the other code to get to the bare bones of the matrix display.
The new version should help work out where it goes wrong.
The print in the code keeps working so it's just the matric part that displays an issue.
I'm quite happy for you to make any changes you would like. In my real program the print is outside the loop (in a function) and prints out a number of sensor values.
rm-hull
commented
7 years ago I've had your program running with time.sleep(0.01) and it has counted up-to 48000 now without any problems or glitches. Admittedly this is without waiting for 5 hours - I will run it overnight to see if that makes any difference with the sleep time set to 1 second.
A few other questions in the meantime:-
serial = spi(port=0, device=0, gpio=noop())) , do you still see the same behaviour?I assume you have the latest versions of the luma components installed, check with:
$ pip list | grep lumaAnd update with
$ sudo -H pip install -U luma.oled luma.coreHI Richard,
Using the program I sent you the system has been running now since 10am updating every second and at 25k plus now.
Tomorrow I will move all my sensor stuff into the current program and see what happens.
Have you got a link to the place where you bought the 8x8 LED matrices from? I will try to get one, My hardware guy sourced them
How have you wired up the devices - can you post a pic of your wiring? As per your suggestions.
All into the botton of the first matrix and then common to the other boards with the exception of the DOUT from the top of Board 1 to DIN of Board 2 and so on down the line.
Are you using the 3.3V for power or 5.0V? 5.0V
Do you have any other devices connected to the GPIO headers? No not at the moment.
The sensors are connected using A2D converters. So in full mode they are. I’ll check the board design again with my hardware guy but prior to adding the LED matrix boards the system had been running for over 2 weeks without interruption or issues.
Do you have any other programs that run periodically (e.g. via crontab) that might interact with the SPI bus at the same time as your program? No but the normal program updates a MySQL database at 1 second intervals
If you change to use CE1 instead of CE0 and alter the program accordingly (the line: serial = spi(port=0, device=0, gpio=noop())) , do you still see the same behaviour?
I’m not sure I understand what you mean by this. Are you asking me to move a connection on the pi and change the code? If so which pin and what should the line be changed to?
I assume you have the latest versions of the luma components installed, check with:
$ pip list | grep luma I assume they are but I’ll let the current test run overnight and then try this tomorrow.
And update with
$ sudo -H pip install -U luma.oled luma.core Again, I’ll let the current test run overnight and then try this tomorrow.
Thanks for your responses. Don’t spend any more time on this as it’s looking as though it’s an issue at my end. I’ll investigate further and let you know when I find a solution.
Thanks again for all you help.
Regards
Tim Wareing
timwareing
commented
7 years ago Hi Richard
Further info :
$ pip list | grep luma
Luma.core (0.9.1)
Luma.led.matrix (0.10.1)
$ sudo -H pip install -U luma.oled luma.core
$ pip list | grep luma
Luma.core (0.9.2)
Luma.led.matrix (0.10.1)
Luma.oled (2.2.10)
After running overnight the attached was showing in the morning.
John, my hardware guy sourced the matrix from ebay:
If you can suggest a reliable alternative I’m quite happy to order some more.
Now the files have been updated I’ll reboot, re-run and wait again!
Kind regards
Tim Wareing
rm-hull
commented
7 years ago Those ebay units look like the standard ones I've used in the past. I didn't see any attachment though: You might need to drop the pic into the comment field in github instead of sending it as a mail.
I ran your script overnight, and it counted to 38000 (~10.5 hrs) without any error
timwareing
commented
7 years ago 
I'm trying again after the update.
with the script I provided you it ran for more than 12 hours and then created this issue sometime between 12.00 midnight and 8 am.
Is there a way to refresh or reload the drivers within the code? This may be a solution.
rm-hull
commented
7 years ago Interesting - does it always corrupt with that specific LED matrix unit (2nd from right)?
How about trying the following:
timwareing
commented
7 years ago The unit that fails varies. I have been testing this for more than 2 weeks now trying to resolve it.
We have move them to different positions, and rechecked the wiring time and time again. And we've tried from 2 to 5 units, the problem generally presents when 3 or more units are used.
For these results (in the images) I adjusted the program to start the count at 10,000

 Interestingly the same incorrectly lit lights are lit for a 1 and a 2. and for each digit this column of lights should be off for all digits.
I'm about to re-write to print a blank before the number to see if this helps. Any other suggestions greatly accepted.
It's frustrating as I can't force the problem to present, so it's just a case of setting it running and trying to keep an eye on it.
 drspangle
commented
7 years ago
drspangle
commented
7 years ago @timwareing I'm having the same problem, with the same randomness even when I swap out the order of the modules in the cascade. Restarting the python script fixes the problem, but this isn't a sustainable fix.
I'm curious if you're using a 3.3v logic signal on the data, clock, and cs pins on these modules with 5v vcc. I read somewhere that the max7219 is designed for the 5v logic level, and while 3.3v should still be adequate, maybe these glitches are resulting from voltage dropping below spec intermittently, causing stuck pixels.
I wanted to rule out the crap connectors that came with my max7219 4x1 8x8px modules first, but I've bought a boost converter to shift the logic level and when I wire it up I'm curious if it'll fix the very similar issue I'm having.
rm-hull
commented
7 years ago I guess that since two people have independently reported this probably rules out faulty wiring or modules.
Since the problem occurs after a long period, and then 'goes away' just by restarting the program, this maybe indicates there is a memory leak somewhere in the stack: this is going to be difficult to diagnose, but the two main components we rely on are Pillow and py-spidev, so we should try and discount one or the other as the cause.
https://github.com/doceme/py-spidev/issues/56 looks interesting, as this could potentially be the root cause. There is a linked PR with a fix.
 thijstriemstra
commented
7 years ago
thijstriemstra
commented
7 years ago Would be useful to have some way to display info about the leak when it happens after 5 hrs.
drspangle
commented
7 years ago I've actually been able to get the problem to fairly reliably happen after a short period of time, but I'm using 24 modules daisy-chained together running off 5V VCC but with signals sent right from the raspberry pi's CLK, MISO, etc. which are at 3.3V.
By "reliably happen", there's no way to predict which matrix will be affected, and in what way - but it'll happen to at least one of them, usually after about 20 minutes or so. I've seen ones where all of the LEDs are stuck on and off (usually happens toward the far end of the marquee), some with single lines, a few lines, single pixels, a few pixels. It's fairly unpredictable. I've never seen the glitch happen immediately, except due to a faulty/loose connection between modules.
Would be useful to have some way to display info about the leak when it happens after 5 hrs.
Wouldn't this require some form of introspection/debugging into the underlying C code? I expect that's where any memory leaks would be happening. I don't think those components are part of this repo, but it would be nice to know where they exist and how they are associated with this repo's components.
thijstriemstra
commented
7 years ago @drspangle can you give this fork of spidev a try? https://github.com/zeeMonkeez/py-spidev/tree/fix-leak. It's the branch for https://github.com/doceme/py-spidev/pull/57
rm-hull
commented
7 years ago I did wonder about swapping out using the underlying pi-spidev for a pure python implementation - e.g. https://github.com/tomstokes/python-spi
I dont think it would be too difficult, and if the problem still presents this means that py-spidev is probably not the culprit.
rm-hull
commented
7 years ago The other thing we could try is to drop the SPI speed right down, to see if it a timing / cascading issue, what with having 24 devices daisy-chained.
drspangle
commented
7 years ago @rm-hull I'm very willing to do this for debugging, but I'm a bit concerned about a pure python implementation, and/or permanently dropping down the SPI speed - I'm planning to cascade around 80 or so modules, and I worry that even in the current implementation performance is a bit slow (I get around 14fps peak, 12fps average using the performance evaluation script in your rm-hull/luma.examples repo). The performance seems to diminish with more modules, but that's to be expected.
There may be some value, however, in doing a "pure python" implementation that gets translated and compiled using Cython. The static typing, and eliminating marshaling into python objects could potentially give a huge performance boost.
Multithreading might help too (independently of Cython, but likely more so with it), although I'm skeptical. I noted there's some kind of multiprocessing (?) going on in the current implementation of the matrix demo, and while it seems to maximize CPU utilization, I'm not sure whether it's helping or hindering performance.
drspangle
commented
7 years ago can you give this fork of spidev a try?
@thijstriemstra I'll try that, but it may be a day or to before I can get around to it - longer if I run into problems integrating that version of the dependency with this repo.
thijstriemstra
commented
7 years ago You should be able to install it with pip, e.g.:
pip uninstall spidev
pip install -e git://github.com/{ username }/{ reponame }.git@{ tag name }#egg=spidevAh, true enough. I forgot that pip can install directly from the repo like this. This should still work using https rather than SSH, right? I don't have keys or key forwarding set up on my pi, and for a good reason that I can't work around.
thijstriemstra
commented
7 years ago Yeah think so, see pip docs.
rm-hull
commented
7 years ago I'm a bit concerned about a pure python implementation, and/or permanently dropping down the SPI speed
These were only suggestions to try and isolate the issue rather than a permanent fix.
I'd've expected a much (much) higher FPS running with the max7219 class - the derived image size is tiny, and it should blast through the performance script. I can't remember exactly, but I have a recollection that I had 12 cascaded LED matrices in a 4x3 arrangement clocking that perf script at something ridiculous like 450 FPS.
drspangle
commented
7 years ago I'm definitely not seeing performance like that. Any idea why it might be so slow? One possible explanation might be that the prototype setup I'm using is with an old rpi model B. I wouldn't have expected such a massive (i.e. orders of magnitude) increase in performance like what you're suggesting between a model A and what I have. Is there another possible explanation? Perhaps it might account for the glitch in some way.
rm-hull
commented
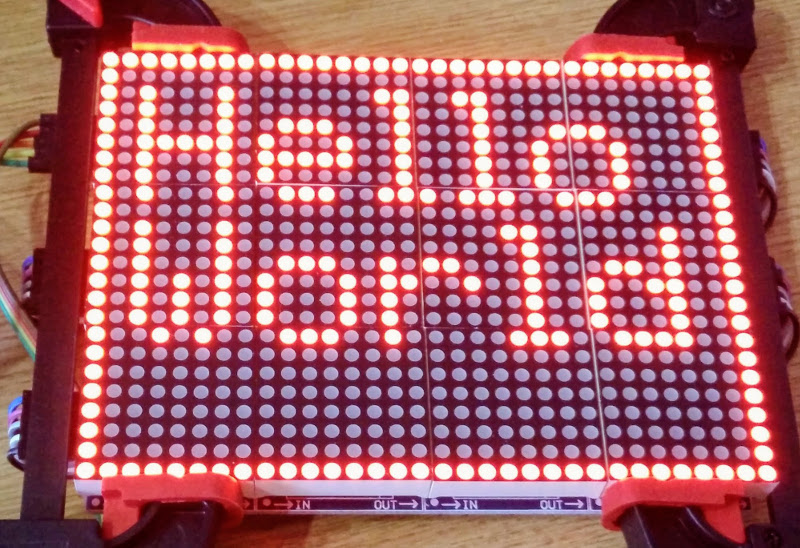
7 years ago On an Orange Pi Zero (which is not as powerful as a Raspberry Pi 2 or 3) with my 12 LED matrices (basically this thing: https://raw.githubusercontent.com/rm-hull/luma.led_matrix/master/doc/images/box_helloworld.jpg):
$ sudo python3 examples/perfloop.py -f conf/max7219.conf --width=32 --height=24 --spi-port=1
Testing dislay rendering performance
Press Ctrl-C to abort test

Display: max7219
Interface: spi
Dimensions: 32 x 24
----------------------------------------
#### iter =   3255: render time = 2.32 ms, frame rate = 428.15 FPS
The perfloop program measures how long it takes to repeatedly render a single frame and then this is the theoretical maximum framerate you can achieve. In essence there is a ~2.32ms overhead to flush a pillow image out onto the display hardware.
Would be interested to see what you get running the above script with your RPi & 24 devices - you'd need to adjust the width & height params accordingly, and probably drop the spi-port (OPi has its SPI ports mapped differently)
rm-hull
commented
6 years ago For reference, the spidev branch with the leak fix can be installed with:
$ sudo pip install -e git+https://github.com/zeeMonkeez/py-spidev.git@fix-leak#egg=spidevAnd I've added the test program from the above comments as examples/issue_108.py. I will run that program with the patched spidev package for a few hours and report back. It should just run with:
$ python example/issue_108.py -n 5Where -n is the number of cascaded devices
drspangle
commented
6 years ago I'll try this too, once I get back. I'm out of the country until Monday.
By the way, for reference I was testing on a Raspberry Pi v1 Model B with 256MB of RAM (i.e. the very first model) and a 16GB SD card, with a big swap size allocated, so it's consistent that this is going to perform significantly worse than your Orange Pi. I really didn't think the difference in performance would be that extreme, though. Do you think there's a possibility that these performance difficulties could have some influence on the glitch?
rm-hull
commented
6 years ago Difficult to know really.
I have a 512mb model B kicking around somewhere so I'll try the perfloop on that for comparison.
Just out of interest what is the output of uname -a on your pi?
drspangle
commented
6 years ago I'll get back to you on that, when I can.
rm-hull
commented
6 years ago On a 512Mb RPi Model B:
$ python examples/perfloop.py -f conf/max7219.conf --width=32 --height=24
Testing display rendering performance
Press Ctrl-C to abort test

Display: max7219
Interface: spi
Dimensions: 32 x 24
----------------------------------------
#### iter = 837: render time = 8.39 ms, frame rate = 112.20 FPSWhat's the performance like on a 192x8 array? You may not have enough modules to see the output, but the rendering speed should simulate the test that I was running.
rm-hull
commented
6 years ago I've had the issue_108.py script running for 14+ hours with the patched spidev (it counted up to 51300 before I hit Ctrl-C) on a 4-core 1GHz RPi Model B2 with 5 cascaded MAX7219 displays, and there was no corruption. I'll retry with the single-core Model B I have but without updating the spidev to see if I can reproduce the glitches.
And the perftest render results from the 512Mb RPi Model B with 192x8:
$ uname -a
Linux raspberrypi 4.4.34+ #930 Wed Nov 23 15:12:30 GMT 2016 armv6l GNU/Linux

$ python examples/perfloop.py -f conf/max7219.conf --width=192 --height=8
Testing display rendering performance
Press Ctrl-C to abort test

Display: max7219
Interface: spi
Dimensions: 192 x 8
----------------------------------------
#### iter =   2945: render time = 12.99 ms, frame rate = 74.03 FPS
Also, I should qualify the following:
see https://luma-led-matrix.readthedocs.io/en/latest/notes.html#cascading-power-supply-level-shifting
drspangle
commented
6 years ago Just out of interest what is the output of uname -a on your pi?
pi@prototype:~ $ uname -a
Linux prototype 4.9.41+ #1023 Tue Aug 8 15:47:12 BST 2017 armv6l GNU/Linux
Interestingly, after uninstalling spidev and then installing the new version of spidev using fix-leak#egg=spidev from above, I was able to achieve a much higher framerate when running perfloop.py. The output on the LEDs, however, is totally garbled. Definitely doesn't look like what I was seeing before. The matrix_demo.py output looks fine on the LEDs, though, so I don't think anything is broken. Have a look at the perfloop.py output:
pi@prototype:~/GitHub/luma.examples $ python3 examples/perfloop.py -f conf/max7219.conf --width=192 --height=8
Testing dislay rendering performance
Press Ctrl-C to abort test

Display: max7219
Interface: spi
Dimensions: 192 x 8
----------------------------------------
#### iter =   1519: render time = 23.80 ms, frame rate = 41.72 FPS
I'll run my own tests and see if the fix has sorted out the glitched pixels.
rm-hull
commented
6 years ago How strange that it is garbled. I would expect it to look something like this:

Can you take a photo and upload it?
As to the speed difference between your Pi vs mine - I was running python 2, which I have observed is definitely faster than python 3.
Some time ago, on my PiZero, I have another project called zaup which shows the 6-digit 2FA codes (much like google authenticator) for various logins - it updates every 30 seconds with a new TOTP code, and I had put it in one of the /etc/rc startup scripts and completely forgot about it.
I was subsequently doing some tests against a PCD8544 LCD on the PiZero and the screen kept getting corrupted, and I couldn't figure out why - I was pouring over the code in luma.lcd looking for what might've caused it, and then it dawned on me that it was using SPI, and the zaup background python script was periodically waking up and sending its payload over the same SPI port & device.
Stopping zaup "fixed" the corruption: so the lesson was that there's clearly nothing stopping multiple devices opening the same /dev/spi0.0 device - worth checking for if you are still seeing corruption...?
drspangle
commented
6 years ago I noticed the glitch still after running my little test script overnight - it's just a modified version of the weather.py example in the luma.examples repo that has a different hardcoded location (Pittsburgh), and loops forever. I ran it with python3 examples\weather.py -d max7219 --width 192 --height 8 --block-orientation -90.
In this instance, the glitch was more uniform than in previous instances, as the exact same pixels were stuck on two different modules in the array, but I'm not sure that's really an interesting observation. It took about an hour for the first glitch to appear, then I checked on it about 9 hours later and saw the second module glitching the same way.
Here is a picture of the glitch:

The module closest to the end of the cascade had the glitch appear first.
Here is a short animation showing how it behaves in action:

Interestingly, I think because of the font size, some of the pixels which are stuck should never actually get activated at any time during the scrolling text, because the font is only 6px high, so none of the pixels around the top and bottom edges of the matrix should ever light.
I'll rerun the perfloop.py and try to get a recording of the output. It definitely doesn't look like what you showed.
drspangle
commented
6 years ago Stopping zaup "fixed" the corruption: so the lesson was that there's clearly nothing stopping multiple devices opening the same /dev/spi0.0 device - worth checking for if you are still seeing corruption...?
As far as I know, I don't have anything else running on the pi except for the python script. Any way to check whether the device is in use by more than one process? I could give you the output of top to see if you see anything interesting, but I'm pretty sure there's nothing else touching the SPI interface.
drspangle
commented
6 years ago I was trying to rerun perftest.py to get a picture of the garbled output, and realized that when I copied your command that used the predefined configuration. That likely had to do with the garbled output. Running perftest.py without using the predefined config file drastically reduced the performance, however.
pi@prototype:~/GitHub/luma.examples $ python3 examples/perfloop.py -d max7219 --width 192 --height 8 --block-orientation -90
Testing dislay rendering performance
Press Ctrl-C to abort test

Display: max7219
Interface: i2c
Dimensions: 192 x 8
----------------------------------------
#### iter =    341: render time = 80.94 ms, frame rate = 12.33 FPS
pi@prototype:~/GitHub/luma.examples $ python3 examples/perfloop.py -f conf/max7219.conf --width=192 --height=8
Testing dislay rendering performance
Press Ctrl-C to abort test

Display: max7219
Interface: spi
Dimensions: 192 x 8
----------------------------------------
#### iter =   4402: render time = 22.30 ms, frame rate = 44.50 FPS
thijstriemstra
commented
6 years ago To clarify, what does conf/max7219.conf contain?
rm-hull
commented
6 years ago conf/max7291.conf is just whats in the luma.examples directory --> https://github.com/rm-hull/luma.examples/blob/master/conf/max7219.conf
Adding --block-orientation 90 is the reason why the performance degrades on your RPi - for every 8x8 block it has to rotate by the correction angle (see https://github.com/rm-hull/luma.led_matrix/blob/master/luma/led_matrix/device.py#L92-L98). This is because some LEDs (particularly the 4-in-1 modules you have) are common-anode rather than common-cathode (or vise-versa). There are a few closed issues relating to this and its documented here
I don't know why your Gen1 RPi performance is so bad; Orange Pi Zero performance with --block-orientation=90 setting:
$ sudo python3 examples/perfloop.py -f conf/max7219.conf --width=192 --height=8 --block-orientation=90
Testing display rendering performance
Press Ctrl-C to abort test

Display: max7219
Interface: spi
Dimensions: 192 x 8
----------------------------------------
#### iter =    651: render time = 10.80 ms, frame rate = 92.39 FPS
re. the glitch - maybe try adding --spi-bus-speed=1000000 to the command line to see if reducing to 1MHz helps?
Have you got anything other than the Gen1 RPi Model B to test with?
Can you try flashing a new raspbian image onto a different SD card and start with a completely clean system?
drspangle
commented
6 years ago re. the glitch - maybe try adding --spi-bus-speed=1000000 to the command line to see if reducing to 1MHz helps?
I'll try this.
Have you got anything other than the Gen1 RPi Model B to test with?
Not presently. I'm planning on buying a pi zero-w in the near future. The gen1 model B is purely for testing and prototyping.
Can you try flashing a new raspbian image onto a different SD card and start with a completely clean system?
I can try this, too. I need to buy a new SD card for this, though, so it'll take a few days.
drspangle
commented
6 years ago @rm-hull A quick update. I ran the modified weather.py as follows:
pi@prototype:~/GitHub/luma.examples $ sudo python3 examples/weather.py -d max7219 --width=192 --height=8 --block-orientation=-90 --spi-bus-speed=1000000The glitch appeared after about an hour or so. I guess turning down the bus speed didn't help. Anything else worth trying before the zero-w and the new SD card arrive on Monday?
thijstriemstra
commented
6 years ago Could the emulator replicate this bug (after x hrs)?
drspangle
commented
6 years ago A few hours later after forgetting that I'd kept this running, I've noticed the glitch has gotten significantly worse than before. Probably doesn't have anything to do with anything, but I've never seen it go this crazy - some modules are dimmed, some of them have many more lines of dead pixels... very strange.

drspangle
commented
6 years ago Checking in on this... shipping delays have prevented me from getting the new SD card to see if that at least resolves the performance issues, but I have the pi zero-w so I will begin getting that set up as soon as possible to test @rm-hull's theory.
rm-hull
commented
6 years ago Good stuff ... just out of interest, what's the power supply you're using?
drspangle
commented
6 years ago This is where I sourced it. I ran some tests on it and it's very stable, very little ripple and reasonable thermal efficiency for a cheap power supply. It's 5V 30A peak.
drspangle
commented
6 years ago @rm-hull Any updates on this? I have everything I need to test this on a "clean" setup. Could you give me some idea of precisely what setup steps you'd like me to take to ensure I don't introduce anything extraneous, or that might mislead me during troubleshooting? Should I just follow https://luma-led-matrix.readthedocs.io/en/latest/install.html precisely and take notes about anything unusual?
rm-hull
commented
6 years ago Yes- just follow the install instructions please and report back. Thanks.
drspangle
commented
6 years ago @rm-hull I finally got a chance to test with a brand new Raspberry Pi Zero-W using the same powersupply and a brand new microSDHC card. Here's what the performance results look like:
pi@raspberrypi:/home/shared/luma.examples $ python examples/perfloop.py -f conmax7219.conf --width=192 --height=8 --block-orientation=90
Testing display rendering performance
Press Ctrl-C to abort test

Version: luma.led_matrix 1.0.7 (luma.core 1.3.0)
Display: max7219
Interface: spi
Dimensions: 192 x 8
------------------------------------------------------------
#### iter =   1271: render time = 44.08 ms, frame rate = 22.52 FPS
Pretty lousy. Next test for tonight, after wiring up all the display modules, is to see whether the display glitch/corruption occurs. Note that I'm using python2.7 rather than python3. That didn't seem to make any difference before, however. This is on a fresh image.
I'm using 5 led Matrix boards attached to a pi 3 Model B V1.2
I'm running a python program which also outputs to a monitor.
The Python program works indefinitely on the monitor but the LED's time out, either going blank or not displaying characters correctly.
As soon as the python program is restarted the display works correctly. No re-boot required
Is there any way to prevent this timeout?