roahmlab / sel_map

Semantic ELevation (SEL) map is a semantic Bayesian inferencing framework for real-time elevation mapping and terrain property estimation from RGB-D images.
https://roahmlab.github.io/sel_map/
MIT License
113 stars 12 forks source link

How can I get the coefficient of friction in rviz? #5

Open sevenzero70 opened 1 year ago

sevenzero70 commented 1 year ago

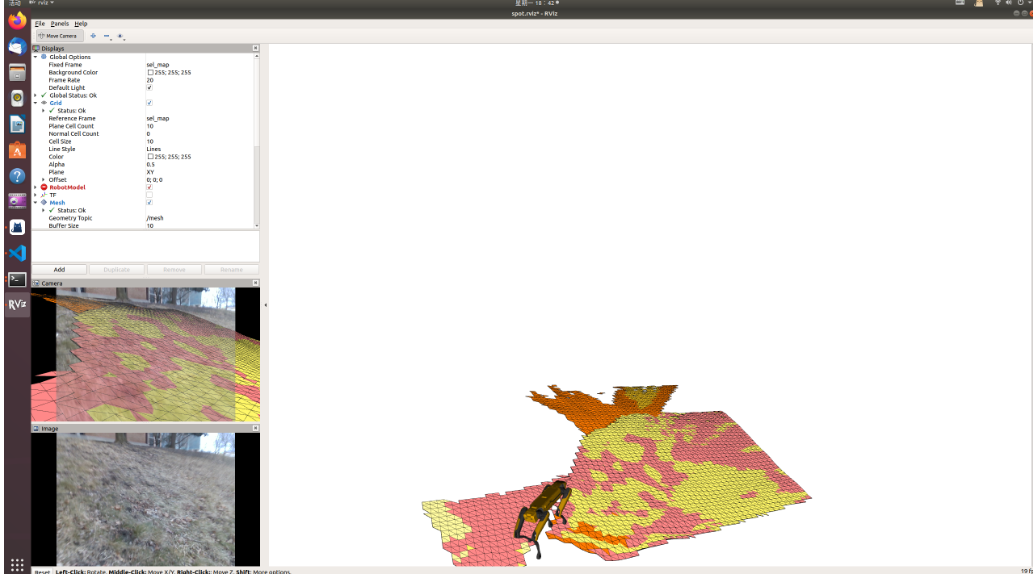
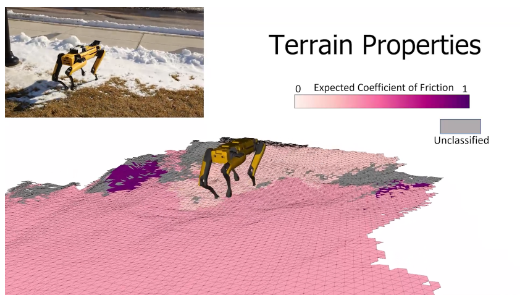
Sorry to bother you after a long time, I get part of the mapping effect when running “spot-comp8.bag” under the default configuration as shown in the figure, but the colors shown in the figure I only find that means the classification of the terrain category. image Besides I want to get an image similar to the second row of Figure 5 in your paper to represent the image of the coefficient of friction, like this. image

and what should I do?Maybe I can change something in elmap.py? Waiting for your reply, thanks.

BuildingAtom commented 1 year ago

Hi @sevenzero70. I'm actually unsure of where those colors, specifically the yellow and orange come from. They don't line up to anything from our package alone, and the colors don't seem to line up to the boundaries of the elements. Is it possible you have something else being visualized which is overlapping the mesh resulting in the off colors? That should should a mostly pink mesh as the hill in spot_comp8.bag should mostly be uniformly classified. spot_comp3.bag which was previously provided may be a better example.

If you'd like to try with the bag from our demonstration video, this is the rosbag we collected from that run: spot_vid2.bag.

Since there was snow for this one, we use terrain_properties:=pascal_context.yaml, and semseg_config:=Encoding_ResNet50_PContext_full.yaml.

sevenzero70 commented 1 year ago

Thanks for your reply. I try to run spot_comp3.bag with "rosbag play -r 0.1 spot_comp3.bag --pause --clock", and at about 4.9s, I find there are still too much color like yellow and orange on rviz. They aren't like classification of terrain, and I cant't find where these colors from. I'm not sure if the slow calculations due to device limitations and end up not getting the correct image in realtime. By the way, I only deploy the code on the CPU, because I don't have GPU to do this.

"/mesh" shown on rviz is like this:

------------------ 原始邮件 ------------------ 发件人: "roahmlab/sel_map" @.>; 发送时间: 2023年3月29日(星期三) 凌晨0:50 @.>; @.**@.>; 主题: Re: [roahmlab/sel_map] How can I get the coefficient of friction in rviz? (Issue #5)

Hi @sevenzero70. I'm actually unsure of where those colors, specifically the yellow and orange come from. They don't line up to anything from our package alone, and the colors don't seem to line up to the boundaries of the elements. Is it possible you have something else being visualized which is overlapping the mesh resulting in the off colors? That should should a mostly pink mesh as the hill in spot_comp8.bag should mostly be uniformly classified. spot_comp3.bag which was previously provided may be a better example.

If you'd like to try with the bag from our demonstration video, this is the rosbag we collected from that run: spot_vid2.bag.

Since there was snow for this one, we use terrain_properties:=pascal_context.yaml, and semseg_config:=Encoding_ResNet50_PContext_full.yaml.

— Reply to this email directly, view it on GitHub, or unsubscribe. You are receiving this because you were mentioned.Message ID: @.***>

BuildingAtom commented 1 year ago

Can you verify that you aren't visualizing something separate of the package? Do you mind sending the RViz file you are using or more details about how your RViz is configured?

sevenzero70 commented 1 year ago

Thanks for your help.

I use the default .rviz of "spot_bag_sel.launch". Besides I find something interesting:when I change the whole elements of "values" in "default.yaml" into a value" - 0, 255, 0", and I get a image with a red gradient like:

when I choose "roslaunch sel_map spot_bag_sel.launch colorscale:=use_properties.yaml", I can get a image about terrian classification like this:

------------------ 原始邮件 ------------------ 发件人: "roahmlab/sel_map" @.>; 发送时间: 2023年4月1日(星期六) 晚上11:02 @.>; @.**@.>; 主题: Re: [roahmlab/sel_map] How can I get the coefficient of friction in rviz? (Issue #5)

Can you verify that you aren't visualizing something separate of the package? Do you mind sending the RViz file you are using or more details about how your RViz is configured?

— Reply to this email directly, view it on GitHub, or unsubscribe. You are receiving this because you were mentioned.Message ID: @.***>

BuildingAtom commented 1 year ago

I don't think any of your images are attaching correctly. Do you mind sending them again?

Also, I understand you're running with the launch file, but can you send the specific .rviz file in use? It appears to have changed locally and I want to see what is being visualized now.

sevenzero70 commented 1 year ago

Sorry, I add the .rviz file and image into the mail, but I don't know why is not shown, wait a minute and let me try again.

------------------ 原始邮件 ------------------ 发件人: "roahmlab/sel_map" @.>; 发送时间: 2023年4月2日(星期天) 凌晨0:20 @.>; @.**@.>; 主题: Re: [roahmlab/sel_map] How can I get the coefficient of friction in rviz? (Issue #5)

I don't think any of your images are attaching correctly. Do you mind sending them again?

Also, I understand you're running with the launch file, but can you send the specific .rviz file in use? It appears to have changed locally and I want to see what is being visualized now.

— Reply to this email directly, view it on GitHub, or unsubscribe. You are receiving this because you were mentioned.Message ID: @.***>

sevenzero70 commented 1 year ago

Hello, I’m sevenzero70, I’m not sure you can get this mail, but maybe there is not compatible in original mail client, so I change another mail address to send to your some message. .rviz file:

red gradient image:

Terrain classification image:

BuildingAtom commented 1 year ago

It still doesn't seem to have worked. I think you may have to try sending the attachments from the GitHub website itself.

sevenzero70 commented 1 year ago

rviz_image.zip

BuildingAtom commented 1 year ago

The files that you have sent to me now do look mostly reasonable, but I do see a possible issue. Can you make sure the buffer size under the Mesh display is set to 1 instead of 10. It seems like this may be causing it to display overlapping meshes instead of clearing the old one like it should be. Though, I'm not running my test system at the moment, so I can't verify that this is the issue for sure and that the .rviz file has no other issues whatsoever.

Otherwise, the files you sent match my expectations given what you've mentioned. The colorscale appears to be working right in the two images you sent. If you added a red RGB value like 0, 255, 0 to the values list, the red gets added as another colorstop for the gradient used in the output, similar to in that picture. The terrain properties also appear roughly as expected.

I was wondering if you had something else visualized in the original image because the yellow and orange colors in the original image don't appear in the colorscale provided from the repository, and they don't seem to line up to the mesh faces. It's most obvious on the diagonals, but the triangle have their main diagonals from top left to bottom right, and there are a few yellow-pink boundaries on the opposite diagonal which shouldn't be possible:

228119762-2570a6b0-9c66-42e6-bde9-aa7991c17dd1

The way the coloring works, it should color an entire mesh face at a time, which is mostly the case in these two example images from the zip file provided. It does seem like there are overlapping meshes (especially in the second image), which is affecting the appearance of the mesh though.

red_gradient_img terrian_classification_img

BuildingAtom commented 1 year ago

Hi @sevenzero70, I just wanted to check in to see if you had any progress in figuring out the issue with the mesh? Were you able to try changing the queue size to see if that solved the issue?

sevenzero70 commented 1 year ago

Thank you for your help, after the last email conversation with you, I have not checked the email until now, because that I was seriously ill and had a fever for several days, I have to apologize for this. According to your description, I try to set the buffer size into 1, and there are no overlaping meshes under the Mesh dispaly; but I still not find if I don't add the value like 0, 255, 0 where the yellow and orange colors from.

------------------ 原始邮件 ------------------ 发件人: "roahmlab/sel_map" @.>; 发送时间: 2023年4月6日(星期四) 上午9:34 @.>; @.**@.>; 主题: Re: [roahmlab/sel_map] How can I get the coefficient of friction in rviz? (Issue #5)

Hi @sevenzero70, I just wanted to check in to see if you had any progress in figuring out the issue with the mesh? Were you able to try changing the queue size to see if that solved the issue?

— Reply to this email directly, view it on GitHub, or unsubscribe. You are receiving this because you were mentioned.Message ID: @.***>

BuildingAtom commented 1 year ago

I see, no worries! Hopefully you're feeling better! So it seems like we have at least addressed the issue of overlapping meshes. Can you perform a git diff with the current repository main and verify that all files are the same?

For example: git diff caea37f61b91f49e84959a8891e933cd7f275146 HEAD >> diff_file.txt and then attach diff_file.txt to this issue

caea37f61b91f49e84959a8891e933cd7f275146 is the current hash of the main branch.