 temospena
commented
4 years ago
temospena
commented
4 years ago something like this?
 https://giscience.github.io/openrouteservice-r/articles/openrouteservice.html
Closed Robinlovelace closed 3 years ago
temospena
commented
4 years ago something like this?
https://giscience.github.io/openrouteservice-r/articles/openrouteservice.html
 Robinlovelace
commented
4 years ago
Robinlovelace
commented
4 years ago That would be amazing!
Robinlovelace
commented
4 years ago Not quite as nice as the example shown, but so far it's working as shown below with base R:
remotes::install_github("itsleeds/slopes")
#> Using github PAT from envvar GITHUB_PAT
#> Skipping install of 'slopes' from a github remote, the SHA1 (9328c753) has not changed since last install.
#>   Use `force = TRUE` to force installation
library(slopes)
r = lisbon_road_segment_3d
plot_slope(r)
Created on 2020-05-04 by the reprex package (v0.3.0)
Robinlovelace
commented
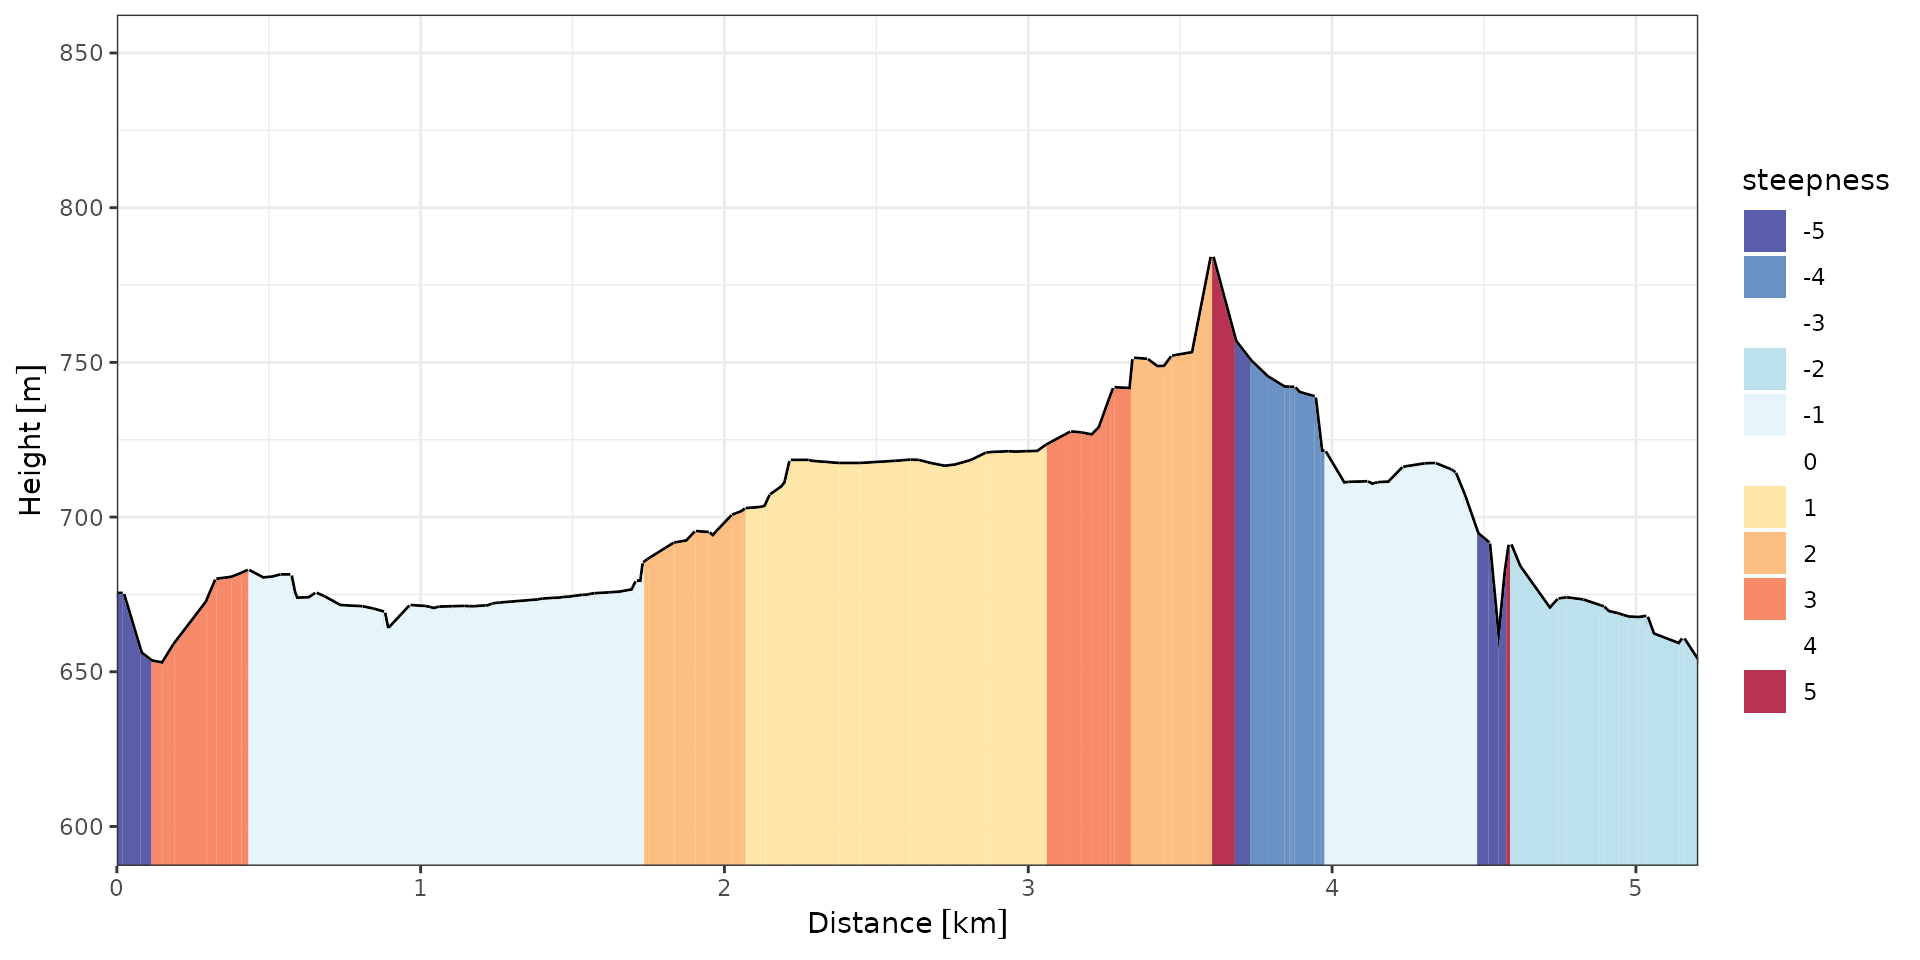
4 years ago Updated slope plot with gradient in both directions:
remotes::install_github("itsleeds/slopes")
#> Using github PAT from envvar GITHUB_PAT
#> Skipping install of 'slopes' from a github remote, the SHA1 (34a60739) has not changed since last install.
#>   Use `force = TRUE` to force installation
library(slopes)
r = lisbon_road_segment_3d
plot_slope(r)
#> Loading required package: colorspace
Created on 2020-05-05 by the reprex package (v0.3.0)
Robinlovelace
commented
4 years ago Another idea is interactive and 3D visualisations, e.g. https://twitter.com/tylermorganwall/status/1257665399446962176
temospena
commented
4 years ago Two more suggestions on this :)
A small function, or an argument, to flip the direction of the route: for instance, if the line is AtoB, be able to plot the elevation profile also as BtoA. It can make things easier to read when thinking of a cycling route, the opposite way
Also plot a colored bar or a small table with the quantification of the percentage of the route that is <0%, 0-3%, 3-5%, 5-10%, >10% (we or be able to choose this thresholds
Robinlovelace
commented
4 years ago Finally looking at this, I think flipping the direction is easy. Regarding the second point, could you provide an example, starting with:
lisbon_route_3d = slope_3d(lisbon_route, dem_lisbon_raster)to provide a table? that could be a separate function that could be included with an argument like summary = TRUE by default...
temospena
commented
4 years ago some experiments to add a colored bar in plot_slope function
#had this
r = lisbon_route_3d
lonlat = sf::st_is_longlat(r)
m = sf::st_coordinates(r)
d = cumsum(sequential_dist(m, lonlat = lonlat))
d = c(0, d)
z = m[, 3]

#want this
g = slope_vector(x = d, e = z)
tr = c(-Inf,-10,-3,3,5,8,10,20,Inf) #adjustable
trlabels = c("steep downhill","downhill","flat","acceptable","steep","very steep", "extreme steep", "no way")
colp = c("#D67AB1","#E2A3C7","#3F7D20","#72B01D","orange","red","darkred", "black")
gd = data.frame(cbind(g,dist=sequential_dist(m, lonlat = lonlat)))
gd = gd[gd$dist !=0,]
gd$stresh = cut(gd$g*100,
              breaks=tr,
              labels=trlabels)
slopesummary = gd %>% group_by(stresh) %>% summarise(distance=sum(dist))
slopesummary$percent = paste0(round(100*slopesummary$distance/sum(slopesummary$distance)),"%")

#plot stacked horizontal
slopesummaryplot = data.frame(slopesummary, row.names=1)
slopesummaryplot = as.matrix(slopesummaryplot)
barplot(slopesummaryplot, legend = F,
         horiz = T, col = colp, border = F)
legend("top", fill = colp, legend = trlabels,
       horiz = TRUE, xpd = F) #needs improvement in r base!

Robinlovelace
commented
3 years ago Really like this more intuitive categorisation of gradients

E.g. like this:
But better!
Source: https://itsleeds.github.io/slopes/reference/slope_matrix.html
Would be great to create a function that did that.