Open rdpeng opened 9 years ago
I would be most interested in this as well.
On Sun, Mar 1, 2015 at 11:10 AM, Roger D. Peng notifications@github.com wrote:
One thing I've always wanted is a 'diff' type output for datasets (let's say tabular datasets for now). When I use git to manage projects, changes to the datasets I use are difficult to visualize using the standard diff output, which is line based. That works when rows are changed but not when columns are added/deleted or transformations are made. Is there a way to categorize the types of changes that can be made to a dataset and then visualize them in a useful way?
— Reply to this email directly or view it on GitHub https://github.com/ropensci/unconf/issues/19.
Awesome! I'm not 100% sure how this would work, but I think for it to be useful it would have to sit on top of git and then maybe show how the dataset changes independent of git's own output. The issue there would then be efficiency....
@rdpeng, are you familar with dat? It's a version control system for data, which feels very similar to git. At the moment, I think it tracks modifications by row only, but I am hoping that column-based diffs will be part of a future release. I agree that something that tracks a variety of transformations/modifications would be very useful.
:+1: I was just talking to @gvwilson about this exact thing earlier this week….
Also have a look at https://github.com/edwindj/daff
Thanks @ledell for mentioning Dat. I'm on my phone so this will be brief but I'll expand later. Dat can natively do diffs and ropensci has a rDat package in the works, waiting on Dat to come to beta (which is soon). I've invited the Dat project to join us and Karissa from their team will join us.
There are some issues with rDat that I'm hoping Jeroen will help resolve. But :100: to pursuing this idea. It should be easy to complete at the event.
Daff looks quite good actually, and seems to implement most of what I was thinking about.
One thing I was hoping to do was implement was something a bit more "intelligent" (and likely more constraining). So for example, if I transform a column by squaring it, is there a way to show that rather than just indicating that every value in the column changed? Perhaps a diff could be expressed via R code rather than the something along the lines of the usual +/- diff format.
@rdpeng your latest comment sounds like a provenance-tracking problem. Are you thinking this will be applied in a system aware of what is done, or does it need to work like diff, I.e. given two datasets and no extra information, tell me the differences?
Pardon if this is slightly off-topic but I want to park these links in a few relevant places, like this thread.
Re: weaning people off of Excel for data inspection and cleaning. OpenRefine comes up a lot and is generally popular with people expecting a GUI. I had always thought it was only mouse driven, but that it wrote some sort of log file. Did not realize these logs are perhaps re-executable. But a recent Twitter conversation intrigues me and also alerted me to Ruby and Python wrappers around the underlying Refine API. @ostephens says:
I'm not sure, to be honest. I think I would need a brief discussion of the pros and cons of either one.
On Mon, Mar 9, 2015 at 5:22 PM, Gabe Becker notifications@github.com wrote:
@rdpeng https://github.com/rdpeng your latest comment sounds like a provenance-tracking problem. Are you thinking this will be applied in a system aware of what is done, or does it need to work like diff, I.e. given two datasets and no extra information, tell me the differences?
— Reply to this email directly or view it on GitHub https://github.com/ropensci/unconf/issues/19#issuecomment-77945678.
Roger D. Peng | @rdpeng https://twitter.com/rdpeng | http://www.biostat.jhsph.edu/~rpeng/
I'm interested in this topic.
Me too! I really like this idea. In the Unix tradition, I think the best approach to an implementation might be a C or C++ library and command line tool (e.g. like curl). The, we could maybe write a simple R wrapper.
Maybe, though that requires us to write it in C/C++ instead of the much easier R. There are benefits (though not that many to R users), but pretty major downsides too.
I would argue that - for prototyping algorithms and features, at least - implementing it initially in R is a more efficient use of our time.
Remember what Duncan always said: for every two lines of C you write, you introduce 3 bugs.
~G
On Mon, Mar 23, 2015 at 10:18 PM, Vince Buffalo notifications@github.com wrote:
Me too! I really like this idea. In the Unix tradition, I think the best approach to an implementation might be a C or C++ library and command line tool (e.g. like curl). The, we could maybe write a simple R wrapper.
— Reply to this email directly or view it on GitHub https://github.com/ropensci/unconf/issues/19#issuecomment-85344082.
Gabriel Becker, PhD Computational Biologist Bioinformatics and Computational Biology Genentech, Inc.
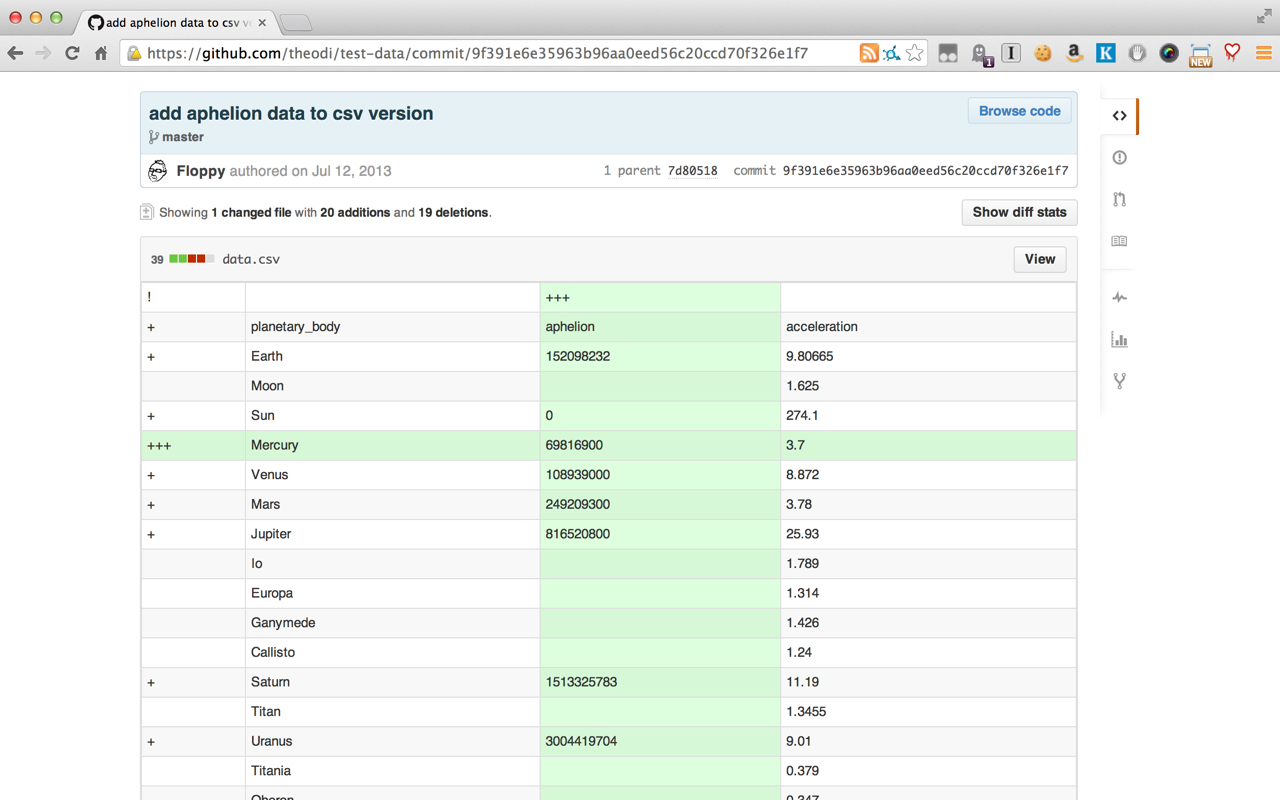
There's a slick little Chrome extension CSVHub that will visualize the daff like differencing of a CSV from within Github:
@bbest Wow! That's fantastic! Oddly it doesn't work with TSV files. I've opened an issue https://github.com/theodi/csvhub/issues/8 to request this feature.
These are the git aliases that I use for diffing TSV and CSV files.
[alias]
wdiff = diff --word-diff=plain
wdiffc = diff --word-diff=color
wdiffcsv = diff --word-diff=color --word-diff-regex=[^,]+
See https://github.com/sjackman/dotfiles/blob/master/.gitconfig#L3-L5
:+1:
thanks for sharing @sjackman :)
Nice, @sjackman!
Very cool. So you mentioned git
uses wdiff
under the hood to diff code by word as well?
I took some notes from our conversation today. Thanks for contributing to the workshop! https://github.com/karissa/dat-visualdiff/issues/1
Good one @sjackman! Here's my little play session with trying out this technique...
# add alias to git's config
git config --global alias.diffcsv "diff --word-diff=color --word-diff-regex=[^,]+"
# initialize repo
git init test_csv; cd test_csv
# 1st commit of test csv
echo -e 'a,b,c\n1,2,3\n4,5,6' > x.csv; cat x.csv
git add x.csv; git commit -m 'initial csv'
# modify csv: b->c, 4->8
echo -e 'a,c,d\n1,2,3\n8,5,6' > x.csv; cat x.csv
# compare against previous commit
git diff x.csv
git diffcsv x.csv
# 2nd commit on modified csv: b->c, 4->8
git commit -a -m 'modified csv'
# modify csv: +e column with 0's
echo -e 'a,c,d,e\n1,4,3,0\n8,5,6,0' > x.csv
# compare against previous commit
git diffcsv x.csv
# 3rd commit on modified csv: +e column with 0's
git commit -a -m 'modified csv again'
# look at history of commits
git log
# compare between specific commits of the csv (swapping from your git log output)
git diffcsv 56515ac..97bfd69 -- x.csv
Following up with @sjackman and @bbest's examples: I moved @bbest's script into R since for us this kind of visual differencing would need to be portable (ie to be able to share it with colleagues outside of your own terminal window).
Unfortunately RStudio doesn't do the color differencing (would that even be possible?) and in fact the display is not useful. What would further options be? @karissa?
Examples and full R script below.
Comparing git diffcsv x.csv
from @bbest's code above run in Terminal and RStudio:
R translation of @bbest's bash script above
# add alias to git's config
system('git config --global alias.diffcsv "diff --word-diff=color --word-diff-regex=[^,]+"')
# initialize repo
system('git init test_csv; cd test_csv')
# 1st commit of test csv
x = data.frame(a = c(1,4), b = c(2,5), c = c(3,6)); x
write.csv(x, 'x.csv', row.names = F)
system("git add x.csv; git commit -m 'initial csv'")
# modify csv: b->c, c->d, 4->8
x = data.frame(a = c(1,8), c = c(2,5), d = c(3,6)); x
write.csv(x, 'x.csv', row.names = F)
# compare against previous commit
system('git diff x.csv')
system('git diffcsv x.csv')
# 2nd commit on modified csv: b->c, 4->8
system("git commit -a -m 'modified csv'")
# modify csv: +e column with 0's
x = data.frame(a = c(1,8), c = c(2,5), d = c(3,6), e = c(0,0)); x
write.csv(x, 'x.csv', row.names = F)
# compare against previous commit
system('git diffcsv x.csv')
# 3rd commit on modified csv: +e column with 0's
system("git commit -a -m 'modified csv again'")
# look at history of commits
system('git log')
# compare between specific commits of the csv (swapping from your git log output)
system('git diffcsv a4c1add0..5cf47e62 -- x.csv')
It's not as pretty, but you can use --word-diff=plain
instead of --word-diff=color
inside of RStudio. It'll use [-foo-]
to indicate removed text and {+bar+}
to indicate added text.
❯❯❯ git diff --word-diff=plain --word-diff-regex='[^,]+' foo.csv bar.csv
diff --git a/foo.csv b/bar.csv
index cbe2c72..46c6789 100644
--- a/foo.csv
+++ b/bar.csv
@@ -1,3 +1,3 @@
A,B,C
1,2,3
4,[-5-]{+7+},6
It's possible that RStudio could render the ANSI colour code escape sequences. Certainly no harm in opening an issue with a feature request.
By the way, pushing the test_csv repo created above to https://github.com/bbest/test_csv and viewing in Google Chrome with CSVHub nicely renders the differences between the following csv commits:
56515ac initial csv
db8644a modified csv: b->c, c->d, 4->8
97bfd69 modified csv again: +e column with 0's
And now for the comparisons using daff style differencing (green add, red delete, blue modify) with the CSVHub Google Chrome extension:
https://github.com/bbest/test_csv/compare/56515ac...db8644a
1st to 2nd: b->c, c->d, 4->8
https://github.com/bbest/test_csv/compare/db8644a...97bfd69
2nd to 3rd: +e column with 0's
https://github.com/bbest/test_csv/compare/56515ac...97bfd69
1st to 3rd: b->c, c->d, 4->8, +e column with 0's
Thanks @bbest!
On Mon, Mar 30, 2015 at 3:05 PM, Ben Best notifications@github.com wrote:
By the way, pushing the test_csv repo created above to https://github.com/bbest/test_csv and viewing in Google Chrome with CSVHub https://chrome.google.com/webstore/detail/csvhub/dbemglgpbebafkibfncdpdmdikacingf nicely renders the differences between the following csv commits:
1.
56515ac initial csv
[image: image] https://cloud.githubusercontent.com/assets/2837257/6907627/b417caec-d6ec-11e4-894b-8de6f330e278.png 2.
db8644a modified csv: b->c, c->d, 4->8
[image: image] https://cloud.githubusercontent.com/assets/2837257/6907643/e060458e-d6ec-11e4-8ce4-252d4aa41a13.png 3.
97bfd69 modified csv again: +e column with 0's
[image: image] https://cloud.githubusercontent.com/assets/2837257/6907638/d4339040-d6ec-11e4-8353-86be4c223ff8.png
And now for the comparisons using daff style differencing (green add, red delete, blue modify) with the CSVHub https://chrome.google.com/webstore/detail/csvhub/dbemglgpbebafkibfncdpdmdikacingf Google Chrome extension:
-
bbest/test_csv@56515ac...db8644a https://github.com/bbest/test_csv/compare/56515ac...db8644a
1st to 2nd: b->c, c->d, 4->8
[image: image] https://cloud.githubusercontent.com/assets/2837257/6907701/465aa78a-d6ed-11e4-8655-1472b0503afe.png
bbest/test_csv@db8644a...97bfd69 https://github.com/bbest/test_csv/compare/db8644a...97bfd69
2nd to 3rd: +e column with 0's
[image: image] https://cloud.githubusercontent.com/assets/2837257/6907719/70ef4596-d6ed-11e4-8670-14d2d6c7df6f.png
bbest/test_csv@56515ac...97bfd69 https://github.com/bbest/test_csv/compare/56515ac...97bfd69 1st to 3rd
1st to 3rd: b->c, c->d, 4->8, +e column with 0's
[image: image] https://cloud.githubusercontent.com/assets/2837257/6907747/ac2ac4e6-d6ed-11e4-9f20-ded7d6355331.png
— Reply to this email directly or view it on GitHub https://github.com/ropensci/unconf/issues/19#issuecomment-87849148.
Julia Stewart Lowndes, PhD Project Scientist, Ocean Health Index http://www.oceanhealthindex.org National Center for Ecological Analysis and Synthesis (NCEAS http://www.nceas.ucsb.edu) University of California, Santa Barbara 735 State Street, Suite 300 Santa Barbara, CA, 93101, USA Phone: 1-805-893-7523
One thing I've always wanted is a 'diff' type output for datasets (let's say tabular datasets for now). When I use git to manage projects, changes to the datasets I use are difficult to visualize using the standard diff output, which is line based. That works when rows are changed but not when columns are added/deleted or transformations are made. Is there a way to categorize the types of changes that can be made to a dataset and then visualize them in a useful way?