nba2020
commented
4 years ago
nba2020
commented
4 years ago Would any more clarification info help? :)
Open AlexSiormpas opened 4 years ago
nba2020
commented
4 years ago Would any more clarification info help? :)
 atroiano
commented
4 years ago
atroiano
commented
4 years ago Not sure I totally understand the dataset, if you can provide an example I might be able to give you more guidance.
That being said, if your observations contain features that are in other observations, you probably want to train the data without shuffling otherwise you are leaking information.
Ideally, you'd want to do the final evaluation on the 3rd set of data that is not used in training or testing. If that still looks good, test it against production data and see how it performs with truly new data (if that's an option).
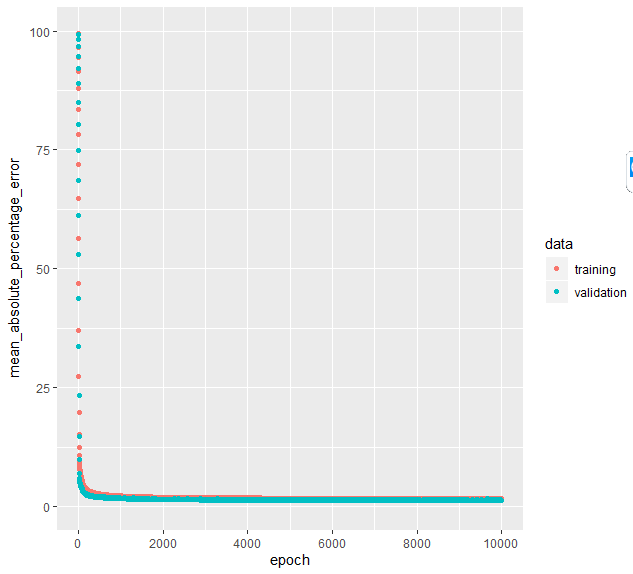
I'm learning Keras in R and want to test a NN regression model on a multivariate time series data set. The goal is to predict Y as a function of its lag and all the other X variables and their corresponding lags. The dataset has ~250 variables and ~4000 daily observations in the following format:
As a 1st step, I split the dataset between
Predictors(Y-1day...X5-50days) andPredict(only Y) matrixes. Then I normalize [min-max]Predictorsbetween 0-1. Finally, I pass the 2 matrixes to Keras model with the implemented code below:After training is done, the last code line plots MAPE error for training and validation as shown below. We can notice that the MAPE on validation decreased down to ~1.3% which looks great. However, I'm am a bit skeptical as I don't see validation loss to increase, despite the high number of epochs. Does this indicate a hidden error or overlooked implementation in my model? How shall I interpret this?