rubisco-sfa / ILAMB-Data

A collection of scripts used to format ILAMB data and community portal to make contributions
9 stars 3 forks source link

Conserving Land-Atmosphere Synthesis Suite (CLASS) v1.1 #6

Closed nocollier closed 2 years ago

nocollier commented 4 years ago

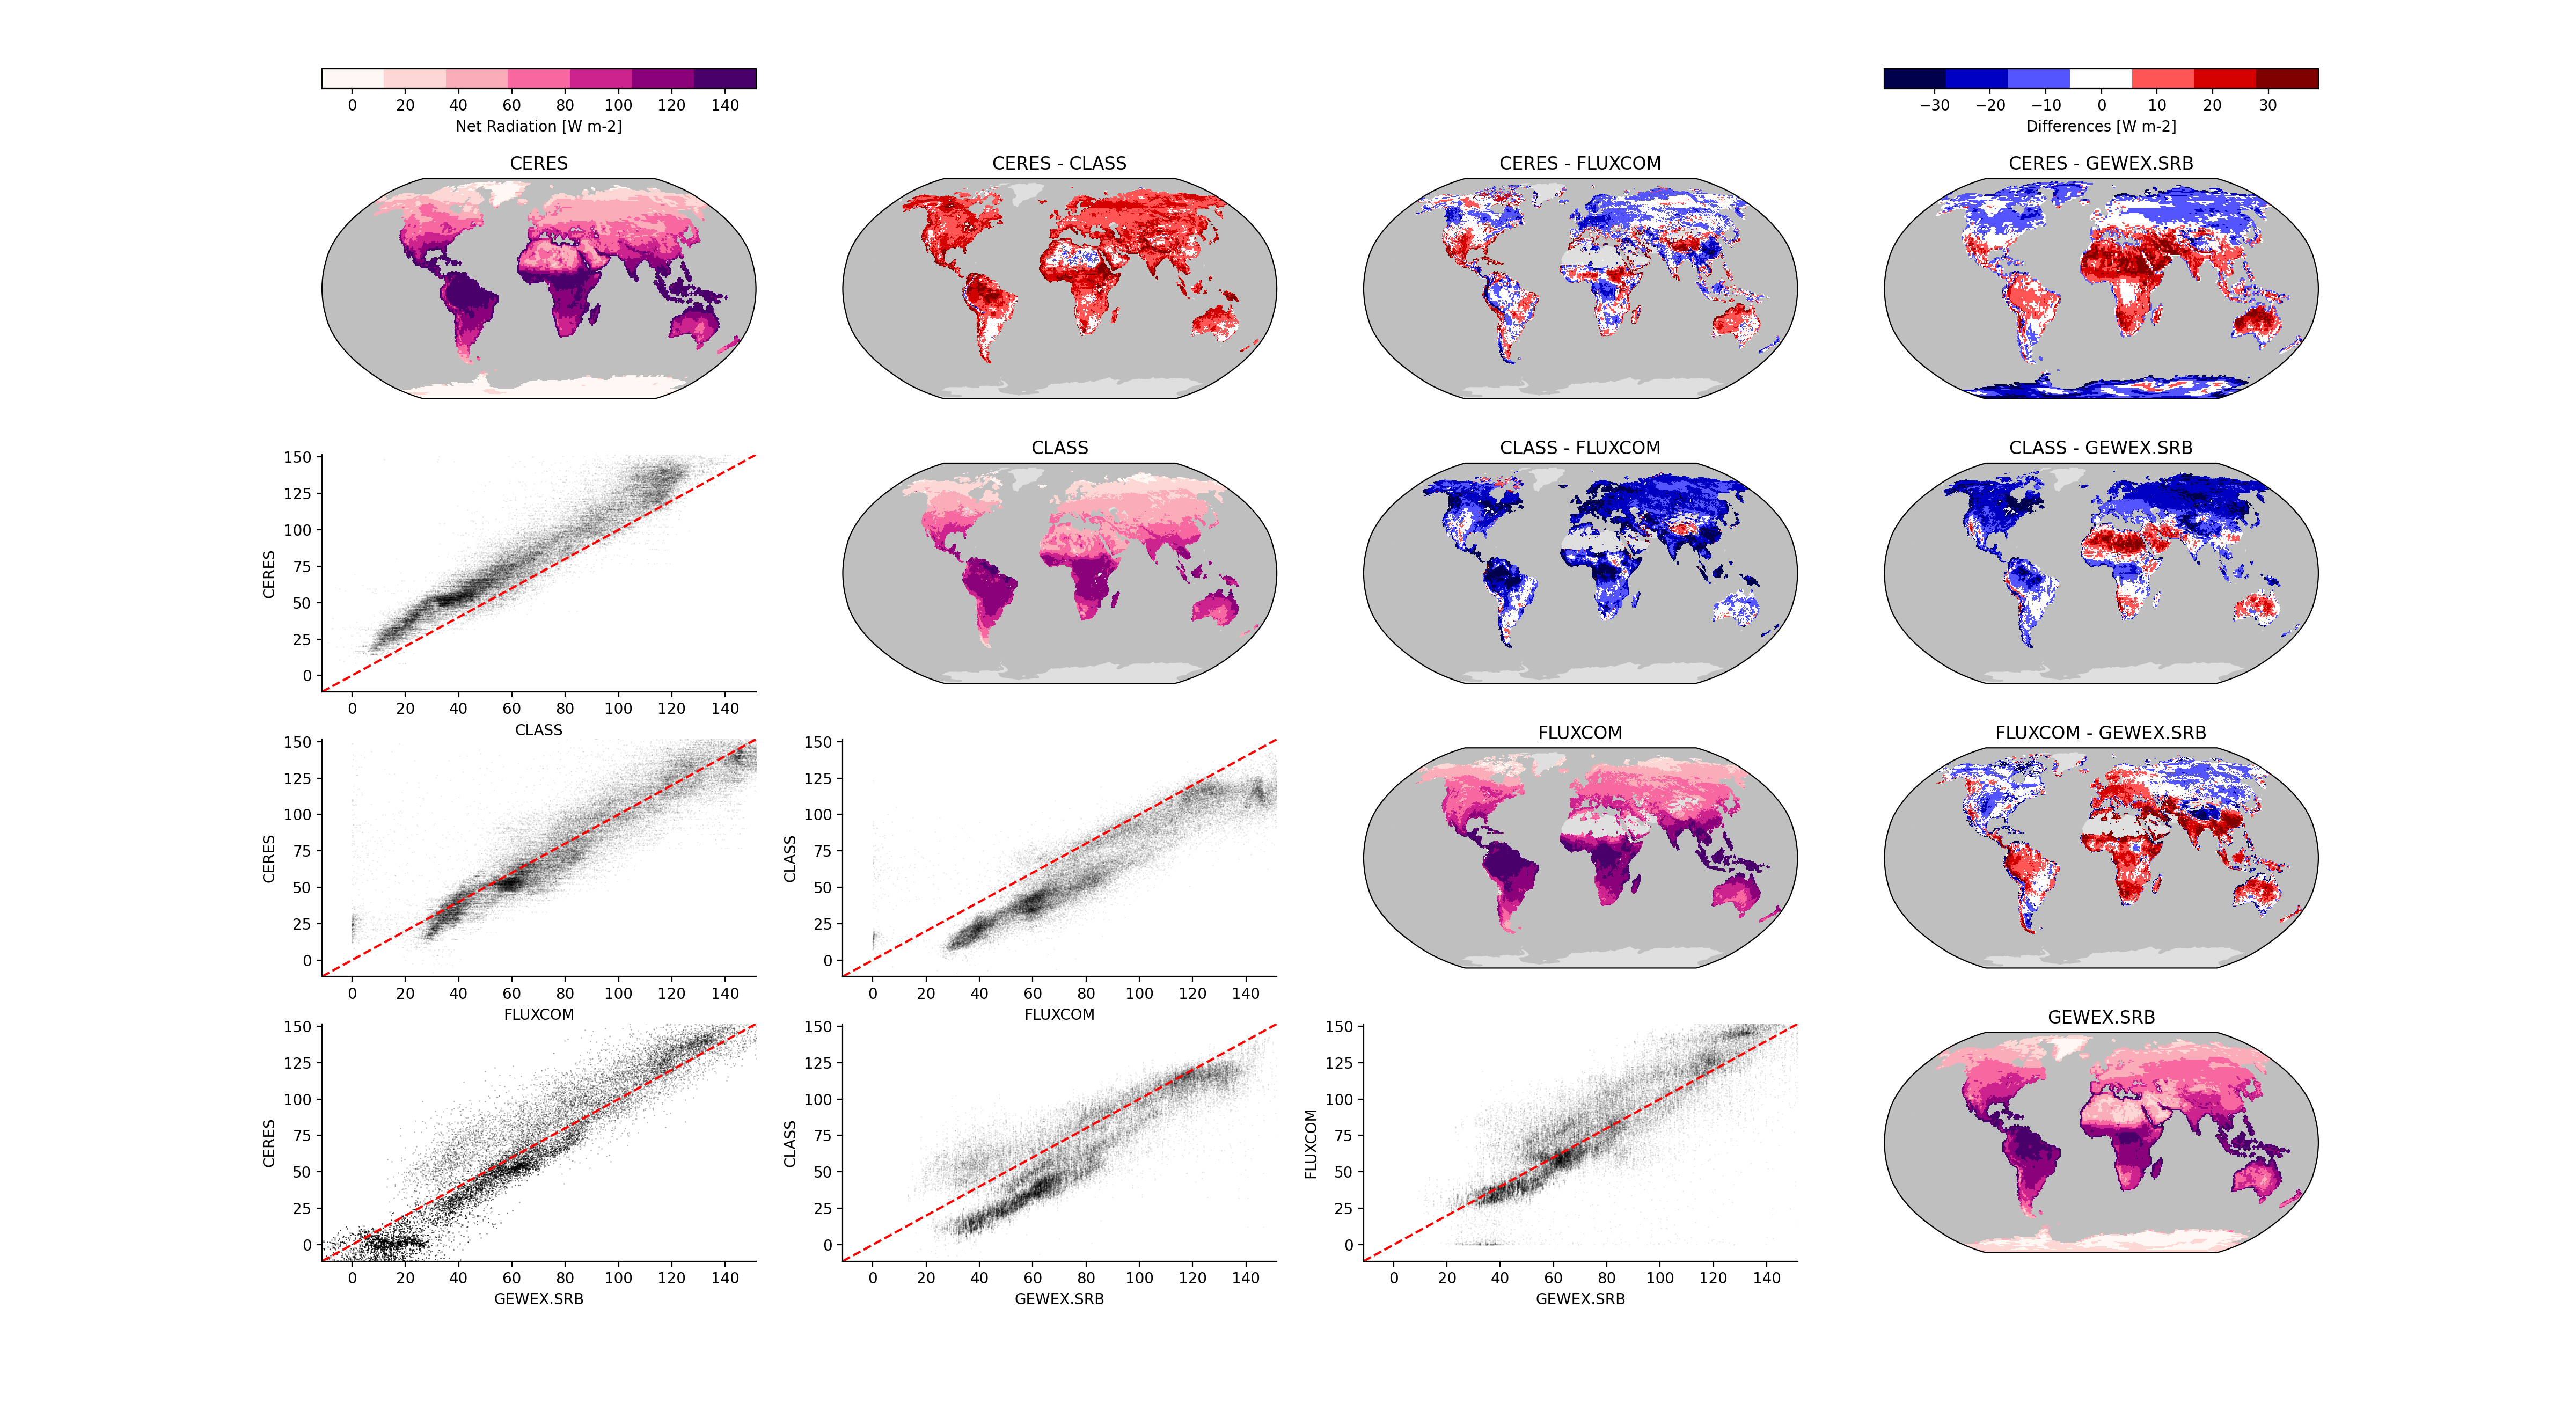
Gab Abramowitz's group has created a globally gridded dataset which simultaneously balances water and energy while also providing estimates of uncertainty based on agreement with site measurements. We are actively working on adding this dataset to ILAMB and also adapting the methodology to make use of the uncertainty measurements.

This issue is meant to represent current progress and provide a location for further comment. We have:

There are a number of open questions to address:

nocollier commented 4 years ago

Dave @dlawrenncar has noticed that this precipitation looks very poor across all models. How does this measure of pr stack up against others? We have decided that running against offline models should provide a better understanding as the precipitation scores should then be quite good.

nocollier commented 4 years ago

Update @climate-dude @dlawrenncar :

The following is an attempt at an alternate view of absolute performance of just the uncertainty bias score. Note that the minimum radius is 0.5 just to make variations easier to eyeball. What I like about this style of reporting is that you can see what aspects of the cycle your model is capturing poorly. Plotting these absolute scores like this does imply that they are somehow comparable--an issue we have thought about for a while. From my point of view, adding in uncertainty helps make them a bit more comparable in that a good score means that variables are within some notion of the observational uncertainty. However, we still have no sense for how 'poor' score compare. Something to keep in mind.

CLASS_bias

dlawrenncar commented 4 years ago

Thanks Nate,

Interesting that bias score is improved for LH in CLM5 but runoff bias score is worse. Also, the biases are both high in global mean (too much LH and too much runoff). Points to an inconsistency in the obs/forcing system somewhere! Maybe it means the GSWP3 P is wrong or exposes a limitation in CLASS? Hmmm. I guess that CLASS must use some observation P product in its methods. I wonder if that data is also available via CLASS. Should see that P used in CLASS is higher than in GSWP3 to be able to explain the high bias in CLM in both LH and runoff.

I noticed that ground heat flux is non-zero across much of the globe in the annual mean in CLASS. That doesn't really make sense since, in the absence of heat storage in the soil due to climate change, annual average ground heat flux should average to ~0. I wonder what ground heat flux really means in CLASS (i.e., does it effectively include heat transfer into the snow?). Maybe it does. Annual mean heat heat flux into soil and snow in CLM (FGR) shows values that are more consistent with CLASS, though there are places even in the tropics in CLASS with ground heat flux distinctly non-zero. I guess would be interesting to see what the timeseries plots look like. Is there a trend that could potentially be related to global warming ... but I think the values are far too big to really be explained by global warming.

http://webext.cgd.ucar.edu/I20TR/clm50_r270_1deg_GSWP3V1_iso_newpopd_hist/lnd/clm50_r270_1deg_GSWP3V1_iso_newpopd_hist.1995_2014-clm45_r270_1deg_GSWP3V1_hist.1995_2014/set2/set2_ANN_FGR.png

I like the method to look at scoring.

On Fri, Apr 3, 2020 at 8:53 AM nocollier notifications@github.com wrote:

Update @climate-dude https://github.com/climate-dude @dlawrenncar https://github.com/dlawrenncar :

  • I ran offline CLM{4,4.5,5} with {GSPW3,CRUNCEP} through the CLASS suite and the results are here https://www.climatemodeling.org/~nate/CLASS/CLM/. Also, see an alternate view of performance below as an image. I have included the change in storage data even though I still score with respect to bias which I think does not make sense with that variable. Adding a skip for this is still on the todo list.
  • CLASS provides an estimate of ground heat flux (hfdsl) which we currently do not benchmark. Very few CMIP6 models have this uploaded on ESGF and none in historical. For the CLM runs, I grabbed FGR12 from their 'h0' files (as per Keith) and added it to the CMORized files.

The following is an attempt at an alternate view of absolute performance of just the uncertainty bias score. Note that the minimum radius is 0.5 just to make variations easier to eyeball. What I like about this style of reporting is that you can see what aspects of the cycle your model is capturing poorly. Plotting these absolute scores like this does imply that they are somehow comparable--an issue we have thought about for a while. From my point of view, adding in uncertainty helps make them a bit more comparable in that a good score means that variables are within some notion of the observational uncertainty. However, we still have no sense for how 'poor' score compare. Something to keep in mind.

[image: CLASS_bias] https://user-images.githubusercontent.com/1331463/78372010-baef2380-7596-11ea-93f9-63d740734322.png

— You are receiving this because you were mentioned. Reply to this email directly, view it on GitHub https://github.com/rubisco-sfa/ILAMB-Data/issues/6#issuecomment-608483135, or unsubscribe https://github.com/notifications/unsubscribe-auth/AFABYVEPFAREI53GDUF6U7TRKXZ6ZANCNFSM4LN3ALGA .

dlawrenncar commented 2 years ago

I looked at what CMIP variables are available for ground heat flux. I found only hfdsl, which is only requested daily as far as I can tell. This is the downward heat flux into the ground. When analyzing this field, it will be important to figure out if the obs are the heat flux into the ground or the heat flux into the surface. If the surface, then this is means that when there is snow, it accounts for that flux. If the ground, then it is just the heat flux into the ground, which could be under snow.

nocollier commented 2 years ago

Publication: https://journals.ametsoc.org/view/journals/clim/33/5/jcli-d-19-0036.1.xml

The introduction mentions "ground heat flux G transferred to the subsurface", but I am not sure if this implies any clear interpretation. I am thinking that interpretation will depend more on the datasets that they combine. Table 2 lists:

I am not familiar with any of these, but perhaps their use implies an interpretation? If we cannot find a commensurate variable, or one does not exist in the output, we can just skip this. Perhaps it is worth thinking about adding to monthly output tables?

The water storage term I interpreted from equation (1):

P = ET + Q + ΔS

and so I used this equation in the ilamb configure:

pr-evspsbl-mrro

For some reason I called this variable dw, probably thinking 'change in water'. Now that I think about it, this is the definition of tws (terrestrial water storage)? Or at least the change in storage term from which we compute an anomaly?

dlawrenncar commented 2 years ago

Sounds like it is the actual ground heat flux, which is good. I would include it in the list of variables. It is definitely something that models simulate, but I think CMIP just 'forgot' to include it. It really should be in CMIP data request. For CLM/ELM, the variable is FGR12, so we can look at it in those runs. We will know pretty quickly if it isn't actually representing ground heat flux by seeing what the values are in winter ... which should be close to zero due to insulation from snow.

For water storage, I agree, this is essentially a version of TWS, but presented as the month to month change in TWS. It looks to me like this dataset is just using TWS from GRACE that we already are using, so it isn't actually providing any 'new' information. For now, I guess I would suggest not using it. It would only be relevant if we were trying to close the water budget, or something like that.

Best,

Dave

On Thu, May 19, 2022 at 8:24 AM nocollier @.***> wrote:

Publication: https://journals.ametsoc.org/view/journals/clim/33/5/jcli-d-19-0036.1.xml

The introduction mentions "ground heat flux G transferred to the subsurface", but I am not sure if this implies any clear interpretation. I am thinking that interpretation will depend more on the datasets that they combine. Table 2 lists:

  • MERRA-2 Land surface diagnostics
  • MERRA-2 Surface flux diagnostics
  • GLDAS-Noah
  • NCEP-NCAR
  • NCEP-DOE
  • FLUXNET2015 tier 1

I am not familiar with any of these, but perhaps their use implies an interpretation? If we cannot find a commensurate variable, or one does not exist in the output, we can just skip this. Perhaps it is worth thinking about adding to monthly output tables?

The water storage term I interpreted from equation (1):

P = ET + Q + ΔS

and so I used this equation in the ilamb configure:

pr-evspsbl-mrro

For some reason I called this variable dw, probably thinking 'change in water'. Now that I think about it, this is the definition of tws (terrestrial water storage)?

— Reply to this email directly, view it on GitHub https://github.com/rubisco-sfa/ILAMB-Data/issues/6#issuecomment-1131770019, or unsubscribe https://github.com/notifications/unsubscribe-auth/AFABYVDDM55O6KITP2TUJULVKZFKVANCNFSM4LN3ALGA . You are receiving this because you were mentioned.Message ID: @.***>

nocollier commented 2 years ago

Ok, I will lose the water storage term but rename and include the ground heat in ilamb.cfg even though for the CMIP6 comparison it will be blank for now. I see data for some land-hist runs so we could include it in that comparison. As you say, the data is daily and so the comparison might be slow. ILAMB will detect that the reference is monthly and coarsen out the model as needed. Let's see what happens.

Another question: what all belongs in what in the paper is Rn, the surface net radiation? The paper says 'A key role of the land surface in the climate system is to absorb solar and atmospheric radiation (surface net radiation Rn)' and so I interpreted this as rns = rlds-rlus+rsds-rsus (down minus up) but CLASS seems almost universally low relative to other products in our collection:

https://www.climatemodeling.org/~nate/ILAMB-Test/comparisons/rns.png

It makes me wonder if I have this definition correct. Or is this a feature of the CLASS dataset?

dlawrenncar commented 2 years ago

Your equation looks correct for rns, though there can always be sign errors if the definition of the direction of each flux is ambiguous. Shouldn't be, but that's something to look at carefully. Did you look at each of the fluxes independently, or does CLASS just provide Rnet. In ILAMB, we have all the individual fluxes, so you could see if CLASS is different for just one of them or all of them. Barring any info from that analysis, you may need to ask Gab if he has insight.

On Thu, May 19, 2022 at 11:55 AM nocollier @.***> wrote:

Ok, I will lose the water storage term but rename and include the ground heat in ilamb.cfg even though for the CMIP6 comparison it will be blank for now. I see data for some land-hist runs so we could include it in that comparison. As you say, the data is daily and so the comparison might be slow. ILAMB will detect that the reference is monthly and coarsen out the model as needed. Let's see what happens.

Another question: what all belongs in what in the paper is Rn, the surface net radiation? The paper says 'A key role of the land surface in the climate system is to absorb solar and atmospheric radiation (surface net radiation Rn)' and so I interpreted this as rns = rlds-rlus+rsds-rsus (down minus up) but CLASS seems almost universally low relative to other products in our collection:

https://www.climatemodeling.org/~nate/ILAMB-Test/comparisons/rns.png

It makes me wonder if I have this definition correct. Or is this a feature of the CLASS dataset?

— Reply to this email directly, view it on GitHub https://github.com/rubisco-sfa/ILAMB-Data/issues/6#issuecomment-1132015468, or unsubscribe https://github.com/notifications/unsubscribe-auth/AFABYVF4SCYZZJX47POZRSTVKZ6BFANCNFSM4LN3ALGA . You are receiving this because you were mentioned.Message ID: @.***>

nocollier commented 2 years ago

I ran a check for how well correlated CLASS rns is to all possible combinations of the radiation components from the CERES product. Basically you nest 4 loops and for a scaling of each component by [-1,0,1] and check the correlation of the sum. The best correlation matches the equation rlds-rlus+rsds-rsus so I think that CLASS radiation is rns and low relative to our other products. They do not have things broken out into components.

dlawrenncar commented 2 years ago

OK. Then I would probably include it for now as an option. I'd be curious to see what it looks like in a land-hist comparison, for example. Does it show up as an outlier from the other datasets and also all the models (when forced with obs). Maybe it is a reasonable alternative reality. If it still looks an outlier, then I could inquire with Gab to see what he thinks ... and also should read their paper in more detail.

On Fri, May 20, 2022 at 10:03 AM nocollier @.***> wrote:

I ran a check for how well correlated CLASS rns is to all possible combinations of the radiation components from the CERES product. Basically you nest 4 loops and for a scaling of each component by [-1,0,1] and check the correlation of the sum. The best correlation matches the equation rlds-rlus+rsds-rsus so I think that CLASS radiation is rns and low relative to our other products. They do not have things broken out into components.

— Reply to this email directly, view it on GitHub https://github.com/rubisco-sfa/ILAMB-Data/issues/6#issuecomment-1133071877, or unsubscribe https://github.com/notifications/unsubscribe-auth/AFABYVAE3GQI5TRPFRUV5O3VK6ZURANCNFSM4LN3ALGA . You are receiving this because you were mentioned.Message ID: @.***>

nocollier commented 2 years ago

Integrated. See this ILAMB comparison of CMIP6 models. I am going to close this because the dataset is integrated, but there are a few questions left: