 lnicola
commented
4 years ago
lnicola
commented
4 years ago 
Codegen seems to be taking an awful lot of time...
With debug=0:

But overall that's just a tiny improvement.
Closed matklad closed 3 years ago
lnicola
commented
4 years ago
Codegen seems to be taking an awful lot of time...
With debug=0:
But overall that's just a tiny improvement.
 kjeremy
commented
4 years ago
kjeremy
commented
4 years ago At the moment we carry around 2 versions of winapi which adds over 30 seconds to my build. I can get it down to (I think) one version of 0.2.8 being held back by mio.
kjeremy
commented
4 years ago @Inicola is that cargo timings with build? 88s to generate metadata on ra_hir?
lnicola
commented
4 years ago Yeah, and 102s by default. Maybe there's a lot of generic code?
 matklad
commented
4 years ago
matklad
commented
4 years ago Hm, that reminds me that we should set debug = 1 for the dev profile, to save some disk space...
lnicola
commented
4 years ago Another interesting thing is that I tried to use lld. Even though it helped quite a lot on other projects, it seems to make no difference here.
lnicola
commented
4 years ago Some random -Z self-profile measurements, which don't tell us anything new:
ra_hir:
+-----------------------------------------------+-----------+-----------------+------------+------------+--------------+-----------------------+
| Item                                          | Self time | % of total time | Item count | Cache hits | Blocked time | Incremental load time |
+-----------------------------------------------+-----------+-----------------+------------+------------+--------------+-----------------------+
| LLVM_module_optimize_module_passes            | 129.32s   | 35.794          | 199        | 0          | 0.00ns       | 0.00ns                |
+-----------------------------------------------+-----------+-----------------+------------+------------+--------------+-----------------------+
| LLVM_thin_lto_optimize                        | 75.69s    | 20.950          | 199        | 0          | 0.00ns       | 0.00ns                |
+-----------------------------------------------+-----------+-----------------+------------+------------+--------------+-----------------------+
| LLVM_module_codegen_emit_obj                  | 55.74s    | 15.429          | 199        | 0          | 0.00ns       | 0.00ns                |
+-----------------------------------------------+-----------+-----------------+------------+------------+--------------+-----------------------+
| codegen_crate                                 | 36.53s    | 10.111          | 1          | 0          | 0.00ns       | 0.00ns                |
+-----------------------------------------------+-----------+-----------------+------------+------------+--------------+-----------------------+
| codegen_module                                | 16.45s    | 4.553           | 199        | 0          | 0.00ns       | 0.00ns                |
+-----------------------------------------------+-----------+-----------------+------------+------------+--------------+-----------------------+
| LLVM_thin_lto_import                          | 13.98s    | 3.869           | 199        | 0          | 0.00ns       | 0.00ns                |
+-----------------------------------------------+-----------+-----------------+------------+------------+--------------+-----------------------+
| LLVM_module_optimize_function_passes          | 6.76s     | 1.870           | 199        | 0          | 0.00ns       | 0.00ns                |
+-----------------------------------------------+-----------+-----------------+------------+------------+--------------+-----------------------+
| typeck_tables_of                              | 3.29s     | 0.910           | 2798       | 0          | 0.00ns       | 0.00ns                |
+-----------------------------------------------+-----------+-----------------+------------+------------+--------------+-----------------------+
| LLVM_module_codegen_make_bitcode              | 2.61s     | 0.723           | 199        | 0          | 0.00ns       | 0.00ns                |
+-----------------------------------------------+-----------+-----------------+------------+------------+--------------+-----------------------+
| evaluate_obligation                           | 1.35s     | 0.374           | 79783      | 0          | 0.00ns       | 0.00ns                |
+-----------------------------------------------+-----------+-----------------+------------+------------+--------------+-----------------------+
| monomorphization_collector_graph_walk         | 1.04s     | 0.289           | 1          | 0          | 0.00ns       | 0.00ns                |
+-----------------------------------------------+-----------+-----------------+------------+------------+--------------+-----------------------+ra_ide_api:
+-----------------------------------------------+-----------+-----------------+------------+------------+--------------+-----------------------+
| Item                                          | Self time | % of total time | Item count | Cache hits | Blocked time | Incremental load time |
+-----------------------------------------------+-----------+-----------------+------------+------------+--------------+-----------------------+
| LLVM_module_optimize_module_passes            | 166.80s   | 35.059          | 305        | 0          | 0.00ns       | 0.00ns                |
+-----------------------------------------------+-----------+-----------------+------------+------------+--------------+-----------------------+
| LLVM_thin_lto_optimize                        | 96.95s    | 20.377          | 305        | 0          | 0.00ns       | 0.00ns                |
+-----------------------------------------------+-----------+-----------------+------------+------------+--------------+-----------------------+
| LLVM_module_codegen_emit_obj                  | 69.66s    | 14.642          | 305        | 0          | 0.00ns       | 0.00ns                |
+-----------------------------------------------+-----------+-----------------+------------+------------+--------------+-----------------------+
| codegen_crate                                 | 50.28s    | 10.568          | 1          | 0          | 0.00ns       | 0.00ns                |
+-----------------------------------------------+-----------+-----------------+------------+------------+--------------+-----------------------+
| LLVM_thin_lto_import                          | 26.33s    | 5.533           | 305        | 0          | 0.00ns       | 0.00ns                |
+-----------------------------------------------+-----------+-----------------+------------+------------+--------------+-----------------------+
| codegen_module                                | 25.05s    | 5.266           | 305        | 0          | 0.00ns       | 0.00ns                |
+-----------------------------------------------+-----------+-----------------+------------+------------+--------------+-----------------------+
| LLVM_module_optimize_function_passes          | 10.47s    | 2.200           | 305        | 0          | 0.00ns       | 0.00ns                |
+-----------------------------------------------+-----------+-----------------+------------+------------+--------------+-----------------------+
| LLVM_module_codegen_make_bitcode              | 3.14s     | 0.660           | 305        | 0          | 0.00ns       | 0.00ns                |
+-----------------------------------------------+-----------+-----------------+------------+------------+--------------+-----------------------+
| normalize_projection_ty                       | 1.84s     | 0.386           | 15240      | 0          | 0.00ns       | 0.00ns                |
+-----------------------------------------------+-----------+-----------------+------------+------------+--------------+-----------------------+
| monomorphization_collector_graph_walk         | 1.74s     | 0.367           | 1          | 0          | 0.00ns       | 0.00ns                |
+-----------------------------------------------+-----------+-----------------+------------+------------+--------------+-----------------------+
| evaluate_obligation                           | 1.46s     | 0.307           | 74165      | 0          | 0.00ns       | 0.00ns                |
+-----------------------------------------------+-----------+-----------------+------------+------------+--------------+-----------------------+
| codegen_fulfill_obligation                    | 1.46s     | 0.307           | 23807      | 0          | 0.00ns       | 0.00ns                |
+-----------------------------------------------+-----------+-----------------+------------+------------+--------------+-----------------------+ ice1000
commented
4 years ago
ice1000
commented
4 years ago Will further modularization help?
kjeremy
commented
4 years ago Might be relevant for cargo test https://github.com/rust-lang/cargo/issues/7514
matklad
commented
4 years ago On thing that helps a bit is using lld:
λ cat ~/.cargo/config
[build]
rustflags = [ "-C", "link-arg=-fuse-ld=lld" ]⏎That's strange, I tried it a couple of times, and it made zero difference for RA. It does help a lot on other projects.
 Matthias247
commented
4 years ago
Matthias247
commented
4 years ago Since I now got a fancy desktop PC which is not generally slow here is another observation: The compile cycle does barely use any parallelism.
The following is the CPU utilization for a small edit and recompile inside a file in ra_hir on a 12 core CPU:

The whole cargo build for this picture took 12s - so it's not super annoying. But it looks like it could go a lot faster if more resources are actually used. But I guess that is more likely a rustc than an actual rust-analyzer issue - unless the project is restructured to be more suitable to for parallelism (crates which are not that dependend on each other?).
lnicola
commented
4 years ago I think small, incremental edits parallelize inherently worse, because there's less to compile. Still, it's not so bad:

But it's surprising how much debug info slows things down. Same scenario, touch crates/ra_hir/src/db.rs; cargo build --release -p ra_lsp_server, but with debug = 0 instead of 1:

 jens1o
commented
4 years ago
jens1o
commented
4 years ago How could one disable debug=0 constantly without an extra flag without having to constantly stash the change in Cargo.toml as soon as there's an update?
lnicola
commented
4 years ago That's how, but you might not need to stash that often.
I generally use pull --rebase with autostash, so it doesn't come up most of the time.
matklad
commented
4 years ago Hm, should we put debug=0 into Cargo.toml? I think I personally can live with that, especially if it makes printf debugging faster :-)
We loose line numbers in backtraces, but I think I rarely look at backtraces (but we should retain debug=1 for releases, so that folks can get a useful backtraces from the debugger).
On the side note, one of the things I miss most from IntelliJ is the ability to colorize and linkify backtraces. If we could link rust::paths from backtraces to functions, that would be sooo helpful.
lnicola
commented
4 years ago Hm, should we put debug=0 into Cargo.toml? I think I personally can live with that, especially if it makes printf debugging faster :-)
That depends on whether you're testing on debug or release builds. Re backtraces, unfortunately rust-analyzer pretty much never crashes for me. I've used the debug info for profiling, but I can enable it manually.
jens1o
commented
4 years ago Well, I use rust-analyzer always with install-ra, which means afaic that I use release all the times. :/
matklad
commented
4 years ago It feels like it became significantly works for --release since we've introduced ra_ide_db crate, because now we repeatedly monomorphise hir for the same database in different crates.
matklad
commented
4 years ago Some measurements from today and a time before ra_ide_db introduction https://gist.github.com/matklad/9657836aa0a9ad226a95b6f18d55b3fc


:( :( :(
lnicola
commented
4 years ago I haven't looked over the code (not sure what the polymorphic code is), but is there a way to avoid that, maybe by introducing monomorphic wrappers?
matklad
commented
4 years ago So "introducing monomorphic wrappers" is exactly what ra_ide_db did, and it made things worse.
Ie, making DB non-generic does not work (or, rather, makes things worse), because all functions are still generic, but are now monomorphised in each crate that uses a non-generic database.
lnicola
commented
4 years ago because all functions are still generic
Do you mean things like impl<'db, DB: HirDatabase> Semantics<'db, DB> that are still generic over the database? Can they use RootDatabase instead?
matklad
commented
4 years ago That as well, but mostly all query definitions, like infer_query.
matklad
commented
4 years ago (though, I still haven't really debugged this properly, my understanding of how monomorphisation happens might be wrong)
lnicola
commented
4 years ago I can't try right now, but I'm curious what happens on a non-LTO build. It seemed to me that half of the build time was spent during linking.
matklad
commented
4 years ago with lto=false it is somewhat faster, but the general picture is the same
https://gist.github.com/matklad/c80618d9328546ca28f06ebe9022a327
matklad
commented
4 years ago Ok, looks like my analysis about monomorphisations was only partially correct. I've switch everything to dynamic dispatch in https://github.com/matklad/rust-analyzer/commit/68304de289ba88dda20e242c841859a8348d921f
It reduced the total compile time somewhat, but, contrary to what I've expected, every one of the big crates still takes a long time to compile.
https://gist.github.com/matklad/4a38367f0b2fd8da1c5c4f7c2297c00f
I think it would be very useful to compare self-profile data from the dyn commint and from the corrspondig commit before dyn-ing everything.
kjeremy
commented
4 years ago Is that with lto=false?
matklad
commented
4 years ago Nope, that's with lto.
Total build time for dyn is
real 210.67s
user 1570.88s
sys  15.58s
rss  966300k
for impl is
real 306.74s
user 2288.41s
sys  19.79s
rss 1061588kPerf is essentially the same, binary is slightly smaller:
λ ./target/rust-analyzer-dyn analysis-stats ~/projects/rustraytracer/
Database loaded, 55 roots, 75.137501ms
Crates in this dir: 4
Total modules found: 40
Total declarations: 309
Total functions: 175
Item Collection: 3.382379153s, 0b allocated 0b resident
Total expressions: 4101
Expressions of unknown type: 187 (4%)
Expressions of partially unknown type: 94 (2%)
Type mismatches: 38
Inference: 5.032461187s, 0b allocated 0b resident
Total: 8.414847361s, 0b allocated 0b resident

17:46:38|~/projects/rust-analyzer|master✓
λ ./target/rust-analyzer-impl analysis-stats ~/projects/rustraytracer/
Database loaded, 55 roots, 72.812239ms
Crates in this dir: 4
Total modules found: 40
Total declarations: 309
Total functions: 175
Item Collection: 3.401339997s, 0b allocated 0b resident
Total expressions: 4101
Expressions of unknown type: 187 (4%)
Expressions of partially unknown type: 94 (2%)
Type mismatches: 38
Inference: 5.013217611s, 0b allocated 0b resident
Total: 8.414570169s, 0b allocated 0b resident

λ exa -l -all target/
.rwxr-xr-x 21M matklad 13 Mar 17:47 rust-analyzer-dyn
.rwxr-xr-x 24M matklad 13 Mar 17:47 rust-analyzer-implNo significant difference in debug build-times, about a minute for each.
lnicola
commented
4 years ago I wonder why your binary is so small (21 MB). The one on GitHub is 27 MB and mine is 28.
EDIT: ah, strip -s does that.
matklad
commented
4 years ago And the one on GitHub is presumably linked statically (but still stripped).
kjeremy
commented
4 years ago Maybe cargo-llvm-lines could help us identify some hot spots.
lnicola
commented
4 years ago Some results on the rust-analyzer crate:
  Lines        Copies         Function name
  -----        ------         -------------
 483559 (100%)  15673 (100%)  (TOTAL)
  15650 (3.2%)   1263 (8.1%)  core::ptr::drop_in_place
  13702 (2.8%)     34 (0.2%)  alloc::raw_vec::RawVec<T,A>::grow
  11638 (2.4%)    182 (1.2%)  core::result::Result<T,E>::map
  11547 (2.4%)    178 (1.1%)  core::result::Result<T,E>::map_err
   8855 (1.8%)     35 (0.2%)  rust_analyzer::main_loop::result_to_task
   8249 (1.7%)     59 (0.4%)  <serde_json::value::de::MapDeserializer as serde::de::MapAccess>::next_key_seed
   7463 (1.5%)     58 (0.4%)  serde_json::value::de::visit_object
   7389 (1.5%)     32 (0.2%)  serde::ser::Serializer::collect_seq
   7324 (1.5%)     35 (0.2%)  rust_analyzer::main_loop::PoolDispatcher::parse
   7063 (1.5%)     73 (0.5%)  core::iter::traits::iterator::Iterator::try_fold
   6803 (1.4%)    131 (0.8%)  core::result::Result<T,E>::unwrap_or_else
   6173 (1.3%)     48 (0.3%)  serde_json::value::de::visit_array
   5375 (1.1%)     68 (0.4%)  <serde_json::value::ser::SerializeMap as serde::ser::SerializeMap>::serialize_value
   5214 (1.1%)     88 (0.6%)  core::option::Option<T>::map
   4465 (0.9%)     19 (0.1%)  hashbrown::raw::RawTable<T>::rehash_in_place
   4340 (0.9%)     35 (0.2%)  serde_json::value::de::<impl serde::de::Deserializer for serde_json::value::Value>::deserialize_struct
   3771 (0.8%)     30 (0.2%)  rust_analyzer::main_loop::PoolDispatcher::on
   3728 (0.8%)     49 (0.3%)  <serde_json::value::de::SeqDeserializer as serde::de::SeqAccess>::next_element_seed
   3429 (0.7%)     49 (0.3%)  <serde_json::value::de::MapDeserializer as serde::de::MapAccess>::next_value_seed
   3332 (0.7%)     58 (0.4%)  core::option::Option<T>::ok_or_else
   3193 (0.7%)    145 (0.9%)  serde_json::value::to_value
   3141 (0.6%)     30 (0.2%)  lsp_server::msg::Request::extract
   3083 (0.6%)     39 (0.2%)  alloc::vec::Vec<T>::extend_desugared
   3059 (0.6%)     19 (0.1%)  hashbrown::raw::RawTable<T>::resize
   2856 (0.6%)     24 (0.2%)  hashbrown::raw::RawTable<T>::find
   2732 (0.6%)     60 (0.4%)  core::ptr::swap_nonoverlapping_one
   2720 (0.6%)     68 (0.4%)  serde::ser::SerializeMap::serialize_entry
   2655 (0.5%)     59 (0.4%)  <serde_json::value::de::BorrowedCowStrDeserializer as serde::de::Deserializer>::deserialize_any
   2625 (0.5%)     31 (0.2%)  <alloc::vec::Vec<T> as alloc::vec::SpecExtend<T,I>>::from_iter
   2314 (0.5%)      1 (0.0%)  rust_analyzer::cli::analysis_stats::analysis_stats
   2290 (0.5%)     80 (0.5%)  alloc::alloc::box_free
   2229 (0.5%)     45 (0.3%)  crossbeam_channel::context::Context::with::{{closure}}
   2133 (0.4%)     27 (0.2%)  core::iter::traits::exact_size::ExactSizeIterator::len
   2091 (0.4%)     41 (0.3%)  alloc::raw_vec::RawVec<T,A>::current_memory
2065 (0.4%) 59 (0.4%) serde::de::Visitor::visit_stringAnd ra_ide_db:
    Finished dev [unoptimized] target(s) in 1m 05s
  Lines        Copies         Function name
  -----        ------         -------------
1620843 (100%)  62960 (100%)  (TOTAL)
  61069 (3.8%)   5316 (8.4%)  core::ptr::drop_in_place
  51419 (3.2%)     47 (0.1%)  salsa::derived::slot::Slot<DB,Q,MP>::read_upgrade
  48978 (3.0%)     94 (0.1%)  salsa::derived::slot::Slot<DB,Q,MP>::probe
  36812 (2.3%)    561 (0.9%)  core::result::Result<T,E>::map_err
  35226 (2.2%)    636 (1.0%)  core::option::Option<T>::map
  34771 (2.1%)     47 (0.1%)  <salsa::derived::slot::Slot<DB,Q,MP> as salsa::dependency::DatabaseSlot<DB>>::maybe_changed_since
  34658 (2.1%)     86 (0.1%)  alloc::raw_vec::RawVec<T,A>::grow
  30141 (1.9%)    498 (0.8%)  core::option::Option<T>::ok_or_else
  26176 (1.6%)    571 (0.9%)  core::ptr::swap_nonoverlapping_one
  19537 (1.2%)    249 (0.4%)  alloc::sync::Arc<T>::new
  19045 (1.2%)    196 (0.3%)  core::iter::traits::iterator::Iterator::try_fold
  18565 (1.1%)     79 (0.1%)  hashbrown::raw::RawTable<T>::rehash_in_place
  18207 (1.1%)    153 (0.2%)  hashbrown::raw::RawTable<T>::find
  18146 (1.1%)     43 (0.1%)  std::sync::mpsc::stream::Packet<T>::abort_selection
  17757 (1.1%)    343 (0.5%)  core::result::Result<T,E>::unwrap_or_else
  16966 (1.0%)     47 (0.1%)  salsa::derived::slot::PanicGuard<DB,Q,MP>::overwrite_placeholder
  13416 (0.8%)     43 (0.1%)  std::sync::mpsc::Sender<T>::send
  12719 (0.8%)     79 (0.1%)  hashbrown::raw::RawTable<T>::resize
  12389 (0.8%)     43 (0.1%)  std::sync::mpsc::shared::Packet<T>::try_recv
  12304 (0.8%)    342 (0.5%)  alloc::sync::Arc<T>::drop_slow
  12210 (0.8%)     47 (0.1%)  salsa::derived::slot::Slot<DB,Q,MP>::sweep
  11844 (0.7%)     47 (0.1%)  salsa::derived::slot::Memo<DB,Q>::validate_memoized_value
  11610 (0.7%)     43 (0.1%)  std::sync::mpsc::Receiver<T>::recv
  11452 (0.7%)    166 (0.3%)  core::result::Result<T,E>::map
  11395 (0.7%)     43 (0.1%)  std::sync::mpsc::stream::Packet<T>::try_recv
  11000 (0.7%)     44 (0.1%)  smallvec::SmallVec<A>::try_grow
  10241 (0.6%)     77 (0.1%)  hashbrown::raw::RawTable<T>::new_uninitialized
  10017 (0.6%)    665 (1.1%)  core::ptr::read
   9933 (0.6%)     77 (0.1%)  hashbrown::raw::RawTable<T>::try_with_capacity
   9768 (0.6%)     44 (0.1%)  std::sync::mpsc::sync::Packet<T>::drop_port
   9729 (0.6%)     47 (0.1%)  salsa::lru::LruData<Node>::insert_new
   9682 (0.6%)     47 (0.1%)  salsa::lru::Lru<Node>::record_use
   9458 (0.6%)    291 (0.5%)  <alloc::vec::Vec<T> as core::ops::index::IndexMut<I>>::index_mut
   9429 (0.6%)    347 (0.6%)  alloc::alloc::box_free
   9417 (0.6%)     43 (0.1%)  std::sync::mpsc::stream::Packet<T>::recv
   9417 (0.6%)     43 (0.1%)  std::sync::mpsc::sync::Packet<T>::recv
   9027 (0.6%)    177 (0.3%)  alloc::raw_vec::RawVec<T,A>::current_memory
   8930 (0.6%)     47 (0.1%)  salsa::lru::LruData<Node>::promote_yellow_to_green
   8624 (0.5%)     44 (0.1%)  <std::sync::mpsc::shared::Packet<T> as core::ops::drop::Drop>::drop
   8453 (0.5%)     47 (0.1%)  salsa::runtime::Runtime<DB>::execute_query_implementation
   8154 (0.5%)    196 (0.3%)  <ra_ide_db::RootDatabase as salsa::Database>::salsa_event
   8137 (0.5%)    158 (0.3%)  hashbrown::raw::RawTable<T>::rehash_in_place::{{closure}}
   8020 (0.5%)    564 (0.9%)  salsa::derived::slot::Slot<DB,Q,MP>::probe::{{closure}}
   8004 (0.5%)     43 (0.1%)  std::sync::mpsc::oneshot::Packet<T>::try_recv
   7913 (0.5%)     47 (0.1%)  <salsa::derived::DerivedStorage<DB,Q,MP> as salsa::plumbing::QueryStorageOps<DB,Q>>::try_fetch
   7664 (0.5%)      1 (0.0%)  ra_ide_db::change::<impl ra_ide_db::RootDatabase>::per_query_memory_usage
   7481 (0.5%)    324 (0.5%)  core::mem::replace
   7396 (0.5%)     43 (0.1%)  std::sync::mpsc::sync::Packet<T>::wakeup_senders
   7391 (0.5%)     15 (0.0%)  salsa::interned::InternedStorage<DB,Q>::intern_index
   7360 (0.5%)    320 (0.5%)  core::fmt::ArgumentV1::new
   7285 (0.4%)     47 (0.1%)  salsa::derived::slot::Slot<DB,Q,MP>::register_with_in_progress_thread
   7184 (0.4%)    342 (0.5%)  <alloc::sync::Arc<T> as core::ops::drop::Drop>::drop
   7052 (0.4%)     43 (0.1%)  std::sync::mpsc::shared::Packet<T>::abort_selection
   6840 (0.4%)    342 (0.5%)  core::alloc::layout::Layout::for_value
   6708 (0.4%)     43 (0.1%)  std::sync::mpsc::shared::Packet<T>::recv
   6593 (0.4%)     43 (0.1%)  std::sync::mpsc::shared::Packet<T>::send
   6399 (0.4%)     79 (0.1%)  hashbrown::raw::RawTable<T>::reserve_rehash
   6391 (0.4%)     77 (0.1%)  hashbrown::raw::RawTable<T>::find_insert_slot
   6364 (0.4%)     43 (0.1%)  std::sync::mpsc::stream::Packet<T>::decrement
   6149 (0.4%)     43 (0.1%)  std::sync::mpsc::sync::wait_timeout_receiver
   6134 (0.4%)     72 (0.1%)  hashbrown::rustc_entry::<impl hashbrown::map::HashMap<K,V,S>>::rustc_entry
   6116 (0.4%)     44 (0.1%)  std::sync::mpsc::spsc_queue::Queue<T,ProducerAddition,ConsumerAddition>::pop
   6028 (0.4%)     44 (0.1%)  <std::sync::mpsc::stream::Packet<T> as core::ops::drop::Drop>::drop
   5977 (0.4%)     43 (0.1%)  std::sync::mpsc::oneshot::Packet<T>::recv
   5848 (0.4%)     43 (0.1%)  std::sync::mpsc::shared::Packet<T>::decrement
   5734 (0.4%)     47 (0.1%)  salsa::lru::LruData<Node>::promote_red_to_green
   5687 (0.4%)     47 (0.1%)  salsa::derived::slot::Slot<DB,Q,MP>::read
   5635 (0.3%)    670 (1.1%)  core::mem::maybe_uninit::MaybeUninit<T>::assume_init
   5547 (0.3%)     43 (0.1%)  std::sync::mpsc::oneshot::Packet<T>::upgrade
   5504 (0.3%)     43 (0.1%)  std::sync::mpsc::oneshot::Packet<T>::send
   5332 (0.3%)     43 (0.1%)  std::sync::mpsc::oneshot::Packet<T>::abort_selection
   5324 (0.3%)     44 (0.1%)  <std::sync::mpsc::sync::Packet<T> as core::ops::drop::Drop>::drop
   5226 (0.3%)     78 (0.1%)  <hashbrown::raw::RawIterRange<T> as core::iter::traits::iterator::Iterator>::next
   5205 (0.3%)    343 (0.5%)  alloc::boxed::Box<T>::into_unique
   4988 (0.3%)    344 (0.5%)  alloc::raw_vec::RawVec<T,A>::grow::{{closure}}
   4859 (0.3%)     43 (0.1%)  std::sync::mpsc::sync::wait
   4816 (0.3%)     43 (0.1%)  std::sync::mpsc::stream::Packet<T>::do_send
   4806 (0.3%)    178 (0.3%)  <alloc::raw_vec::RawVec<T,A> as core::ops::drop::Drop>::drop
   4773 (0.3%)     43 (0.1%)  std::sync::mpsc::spsc_queue::Queue<T,ProducerAddition,ConsumerAddition>::with_additions
   4753 (0.3%)     97 (0.2%)  core::iter::traits::iterator::Iterator::find::check::{{closure}}
   4601 (0.3%)     43 (0.1%)  std::sync::mpsc::sync::abort_selection
   4568 (0.3%)    571 (0.9%)  core::ptr::swap_nonoverlapping
   4429 (0.3%)     12 (0.0%)  rayon_core::join::join_context::{{closure}}
   4418 (0.3%)     47 (0.1%)  salsa::lru::LruData<Node>::record_use
   4371 (0.3%)     47 (0.1%)  salsa::derived::slot::Memo<DB,Q>::check_durability
   4269 (0.3%)     45 (0.1%)  <core::iter::adapters::zip::Zip<A,B> as core::iter::adapters::zip::ZipImpl<A,B>>::next
   4257 (0.3%)     43 (0.1%)  std::sync::mpsc::stream::Packet<T>::send
   4170 (0.3%)     94 (0.1%)  salsa::derived::slot::Slot<DB,Q,MP>::read_upgrade::{{closure}}
   4137 (0.3%)    470 (0.7%)  core::cell::UnsafeCell<T>::new
   4094 (0.3%)    178 (0.3%)  core::ptr::slice_from_raw_parts_mut
   4085 (0.3%)     43 (0.1%)  std::sync::mpsc::spsc_queue::Queue<T,ProducerAddition,ConsumerAddition>::alloc
   4059 (0.3%)     72 (0.1%)  hashbrown::raw::RawTable<T>::insert_no_grow
   4039 (0.2%)     90 (0.1%)  core::option::Option<T>::unwrap_or_else
   4002 (0.2%)    667 (1.1%)  core::intrinsics::copy_nonoverlapping
   4002 (0.2%)     95 (0.2%)  core::result::Result<T,E>::unwrap
   3984 (0.2%)     81 (0.1%)  alloc::vec::Vec<T>::push
   3948 (0.2%)    141 (0.2%)  <salsa::derived::slot::Slot<DB,Q,MP> as salsa::dependency::DatabaseSlot<DB>>::maybe_changed_since::{{closure}}
   3910 (0.2%)     44 (0.1%)  std::sync::mpsc::mpsc_queue::Queue<T>::pop
   3904 (0.2%)     47 (0.1%)  std::collections::hash::map::Entry<K,V>::or_insert_with
   3870 (0.2%)     43 (0.1%)  std::sync::mpsc::spsc_queue::Queue<T,ProducerAddition,ConsumerAddition>::push
   3825 (0.2%)    765 (1.2%)  core::mem::size_of
   3810 (0.2%)    617 (1.0%)  core::mem::manually_drop::ManuallyDrop<T>::new
   3747 (0.2%)     72 (0.1%)  std::collections::hash::map::map_entry
   3741 (0.2%)     43 (0.1%)  std::sync::mpsc::channel
I'm not sure how actionable these are.
kjeremy
commented
4 years ago Yeah... I was hoping it would show us if there were a lot of monomorphized things we could reduce.
 panstromek
commented
3 years ago
panstromek
commented
3 years ago @lnicola @kjeremy Note that RawVec::grow, which is pretty high on both of these lists, was recently changed to be mostly non generic in https://github.com/rust-lang/rust/pull/72013. Another similar optimization was done for iterator methods in https://github.com/rust-lang/rust/pull/72166, so they now use try_fold less, which is also pretty high on these lists.
Both PRs reduced the number of llvm-ir lines generated and improved compile time. They will land on stable in next Rust release in July, so until that, you might want to measure with cargo-llvm-lines on nightly to account for these improvements :wink:
lnicola
commented
3 years ago @panstromek thanks for the heads-up. I ran it again on ra_ide_db, it seems worse?
lnicola
commented
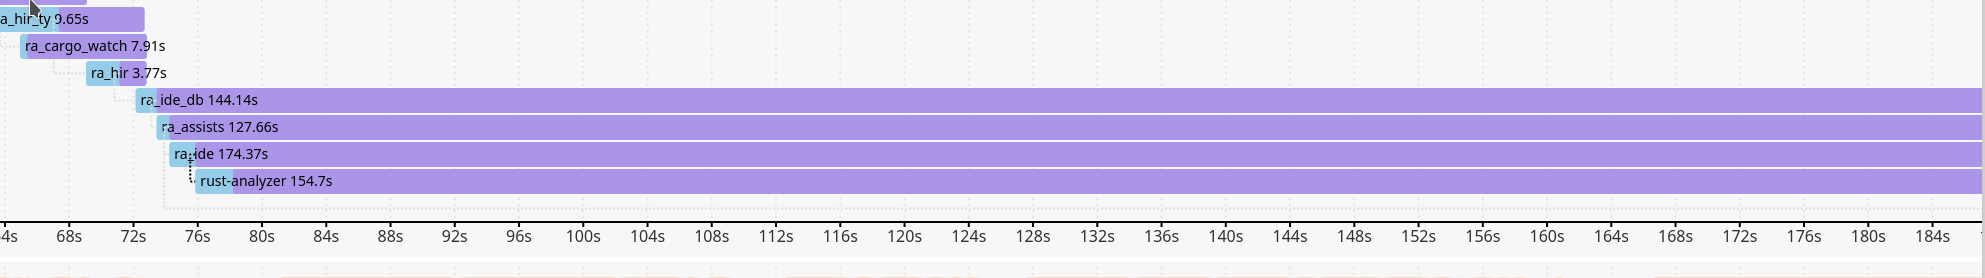
3 years ago It feels like we're getting slower and slower:

matklad
commented
3 years ago To things jump at me as odd:
On Wednesday, 1 July 2020, Laurențiu Nicola notifications@github.com wrote:
It feels like we're getting slower and slower:
[image: image] https://user-images.githubusercontent.com/308347/86206821-f093b080-bb75-11ea-815d-9973bee870cb.png
— You are receiving this because you authored the thread. Reply to this email directly, view it on GitHub https://github.com/rust-analyzer/rust-analyzer/issues/1987#issuecomment-652202248, or unsubscribe https://github.com/notifications/unsubscribe-auth/AANB3M7FRVZECURZQ77T3GTRZLDOTANCNFSM4I7OUNRA .
lnicola
commented
3 years ago Semantics ischalk-solve builds too quickly (chalk-parse takes ages)lnicola
commented
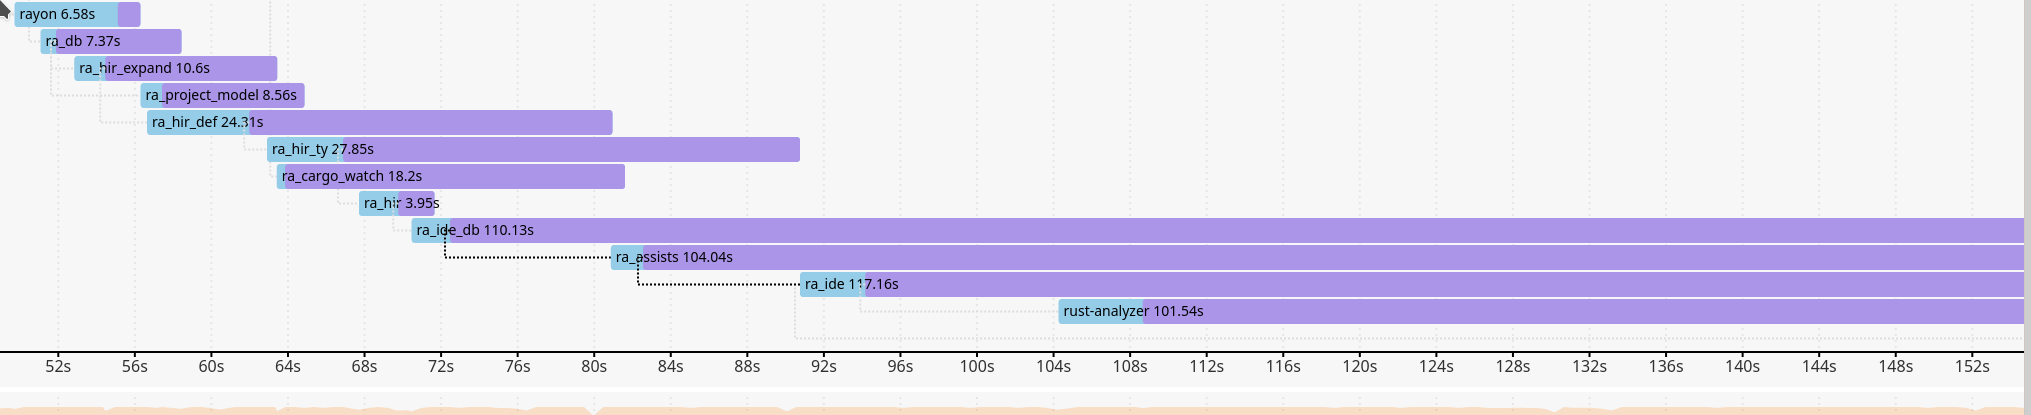
3 years ago After #5242:

lnicola
commented
3 years ago One of my tests is to compile a new crate containing only this code:
use hir::Semantics;
use ra_syntax::{ast, AstNode, SyntaxNode};
pub struct MatchFinder<'db> {
sema: Semantics<'db, ra_ide_db::RootDatabase>,
}
impl<'db> MatchFinder<'db> {
pub fn new(db: &'db ra_ide_db::RootDatabase) -> MatchFinder<'db> {
MatchFinder { sema: Semantics::new(db) }
}
pub fn find_matches(&self, code: &SyntaxNode) {
if let Some(macro_call) = ast::MacroCall::cast(code.clone()) {
self.sema.expand(¯o_call);
}
}
}It takes 11.5 seconds (vs. ~35 last week).
matklad
commented
3 years ago Much more reasonable!
matklad
commented
3 years ago Substantial amount of the rest seems to be serde-generated code. Not sure how to combat that....
matklad
commented
3 years ago  mati865
commented
3 years ago
mati865
commented
3 years ago @lnicola do you have up-to-date CPU usage metrics over time? Combining them with crates build chart would show bottlenecks where only a few cores are used.
Both
ra_hirandra_ide_apiare really slow to compiler, which makesfix & testloop rather frustrating. Note that tests are extremely fast themselves, it's compile time that hurts us badly.We need to do something with it...