 s117
commented
4 years ago
s117
commented
4 years ago There is an ISA simulator branch that provides tracing functionality. https://github.com/s117/riscv-isa-sim/tree/WIB_trace_support
When configured with --enable-dbg-trace flag, this version of spike can trace the core with the following information logged in a human-readable textual format: instruction retirement, register access, memory access, taken branch, exception/interrupt.
Here is a snippet of the trace output:
C/167145 S/167145 PC/0x0000000000004038 (0x00050793) mv      a5, a0
    RS0/a0  0xff7ffff5
    RD/a5   0xff7ffff5

C/167146 S/167146 PC/0x000000000000403c (0x02c7e463) bltu    a5, a2, pc + 40
    RS0/a5  0xff7ffff5
    RS1/a2  0xff800000
    TAKEN_PC    0x00004064

C/167147 S/167147 PC/0x0000000000004064 (0x0005c703) lbu     a4, 0(a1)
    RS0/a1  0x0000dc9b
    RD/a4   0x00000068
    ADDR    0x0000dc9b

C/167148 S/167148 PC/0x0000000000004068 (0x00158593) addi    a1, a1, 1
    RS0/a1  0x0000dc9b
    RD/a1   0x0000dc9c

C/167149 S/167149 PC/0x000000000000406c (0x00178793) addi    a5, a5, 1
    RS0/a5  0xff7ffff5
    RD/a5   0xff7ffff6

C/167150 S/167150 PC/0x0000000000004070 (0xfee78fa3) sb      a4, -1(a5)
    RS0/a5  0xff7ffff6
    RS1/a4  0x00000068
    ADDR    0xff7ffff5
    EXCEPTION   0x0000000000000001
    EVEC    0x00000000000041b0
    ECAUSE  0x000000000000000b
    EPC 0x0000000000004070
    SR  0x000000eb

C/167151 S/167151 PC/0x00000000000041b0 (0x50009073) csrw    sup0, ra
    RS0/ra  0x000023fc

C/167152 S/167152 PC/0x00000000000041b4 (0x50111073) csrw    sup1, sp
    RS0/sp  0x0000dab0
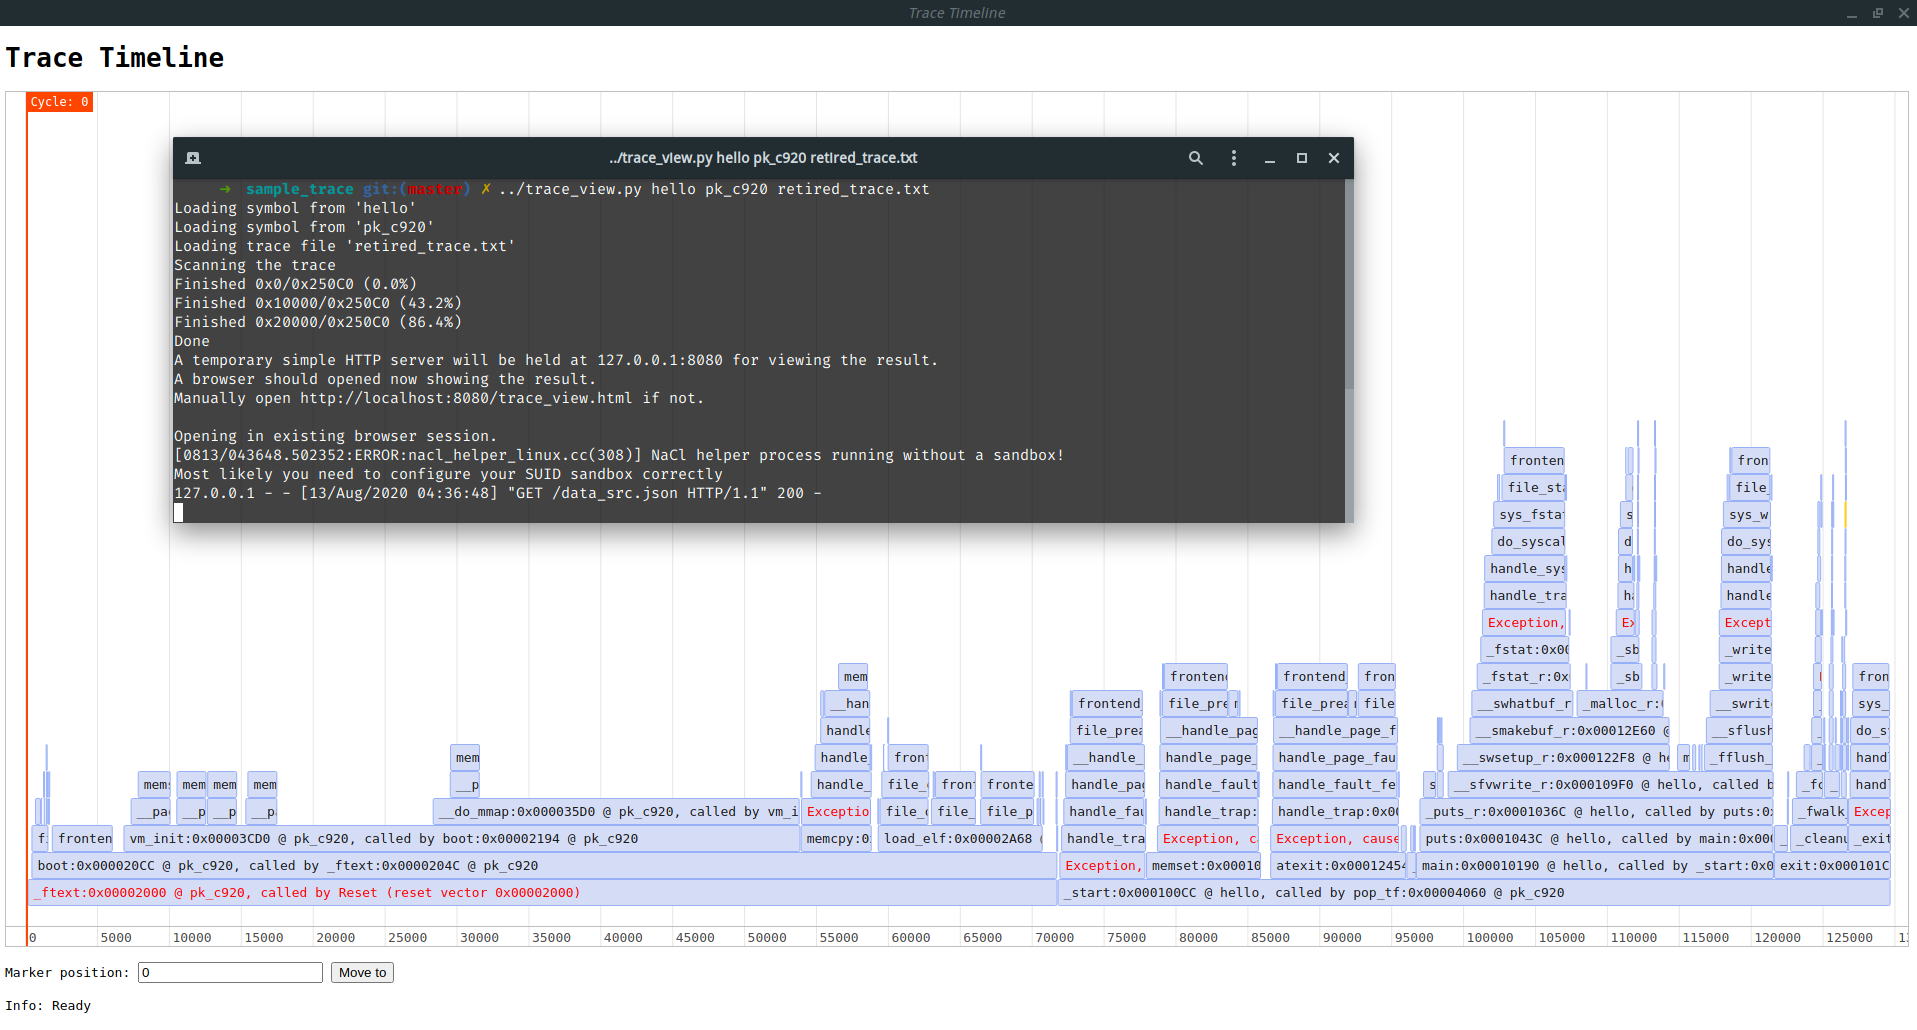
There's another tool that can read in the trace in above format, then visualize the trace as a function call timeline in a web browser (huge thanks to vis-timeline, you saved me from writing a timeline GUI for this task).
Sometimes RISCV code breaks. To understand the reason it breaks, it is good to know the context of the broken code (like the call stack, execution history, value of variables, memory dump, etc).
I think tracing the core would be a good solution. As an execution trace provides all the above information, with proper tools.