Hi @kasayadior,
Can someone provide an interpretation of this observation? For further plan, should I restrict the experiment on the TFs that expressed high and computed with high activity? Or I should keep the selection open as TF transcript level often times is not a reflection of protein level and activity.
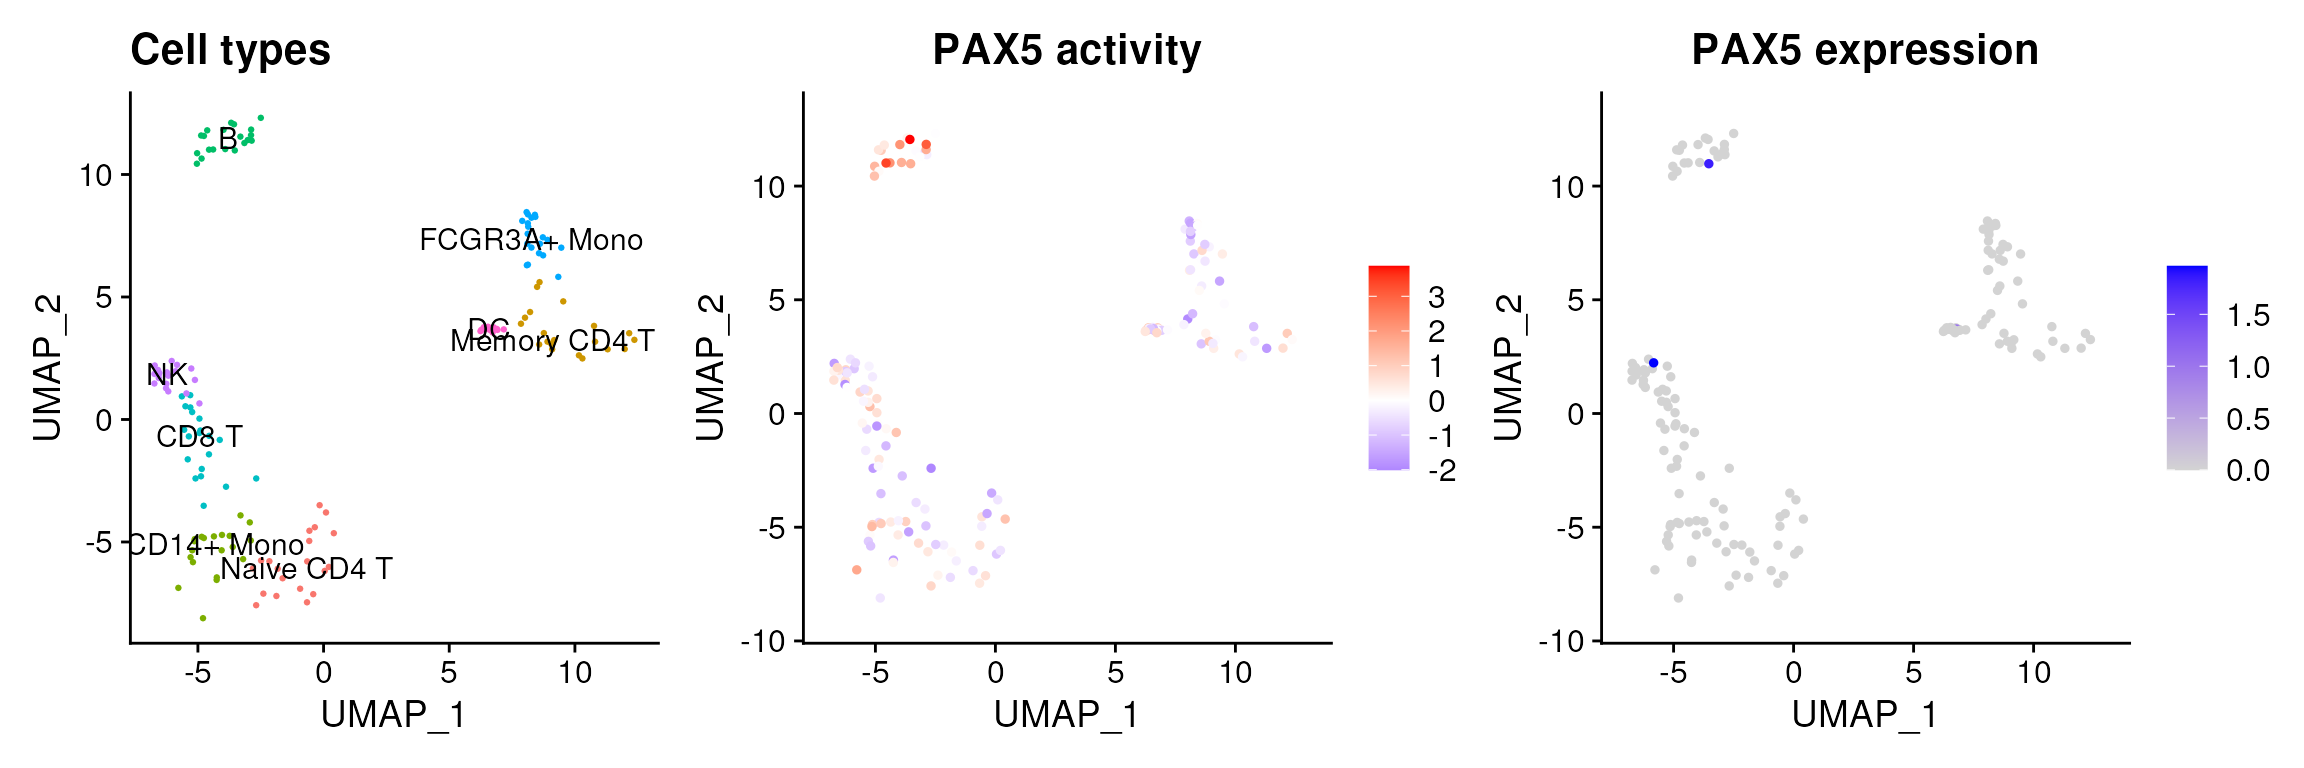
As you mentioned, TF transcript levels are not always good indicators of TF activity. This is why we rely on enrichment scores based on the expression of a TF’s target genes. This issue is even more pronounced in single-cell data, where the expression of the TF can be missed due to technical dropouts.
In the vignettes, I show an example with PAX5, a marker TF of B-cells. Even though it is not highly expressed in these cells, it is predicted to be active, recovering more information than expression values alone.

Filtering based on prior information is possible. For example, you could filter out TFs not present in your gene expression matrix. Alternatively, you could check whether the TF has detectable protein abundance in the Human Protein Atlas (you can retrieve this with decoupleR::get_resource or in their web portal).
I hope this helps! Let me know if you have further questions.
Hope this is helpful! Let me know if you have further questions.
Dear support team,
I have a question related to the interpretation of TF activity using the scRNA-seq data. Here is my initial result from the most variable TF activity in the data set: It looks promising so I further plot some of the TFs in the RNA assay to see if the TF is being expressed:

Not every TF has a higher expression when the computed activity is high. On the contrary, some of the TF being expressed high across cell types is computed with low activity.
Both of the expression are average scaled expression. Thus they are relative within the cells being plotted.
Can someone provide an interpretation of this observation? For further plan, should I restrict the experiment on the TFs that expressed high and computed with high activity? Or I should keep the selection open as TF transcript level often times is not a reflection of protein level and activity.
Is it possible to implement a function to link TF expression when TF activity is predicted active/score high in the current package?
Thank you for your valuable thoughts.