 PauBadiaM
commented
1 year ago
PauBadiaM
commented
1 year ago Hi @imerelli,
You could do something like this:
tfs <- c('AHR', 'STAT5A', 'PAX5')  # List of interesting TFs by activity
genes <- unique(rownames(counts))  # Genes in your column matrix

# Generate adjancency matrix for your network
net_adj_mat <- net %>%
  filter(source %in% tfs) %>%  # Select relevant TFs
  filter(target %in% genes) %>%  # Select genes found in your column matrix
  pivot_wider(names_from = source, id_cols = target, values_from = mor) %>%  # Transform into matrix
  column_to_rownames('target')
net_adj_mat[is.na(net_adj_mat)] <- 0.  # Set Nans to 0s

# Plot
pheatmap(net_adj_mat)
The problem with this is that it might be the case that there many target genes which will be hard to plot. If this is the case, you could then filter genes by their weight or if they are present in more than one of your TFs of interest.
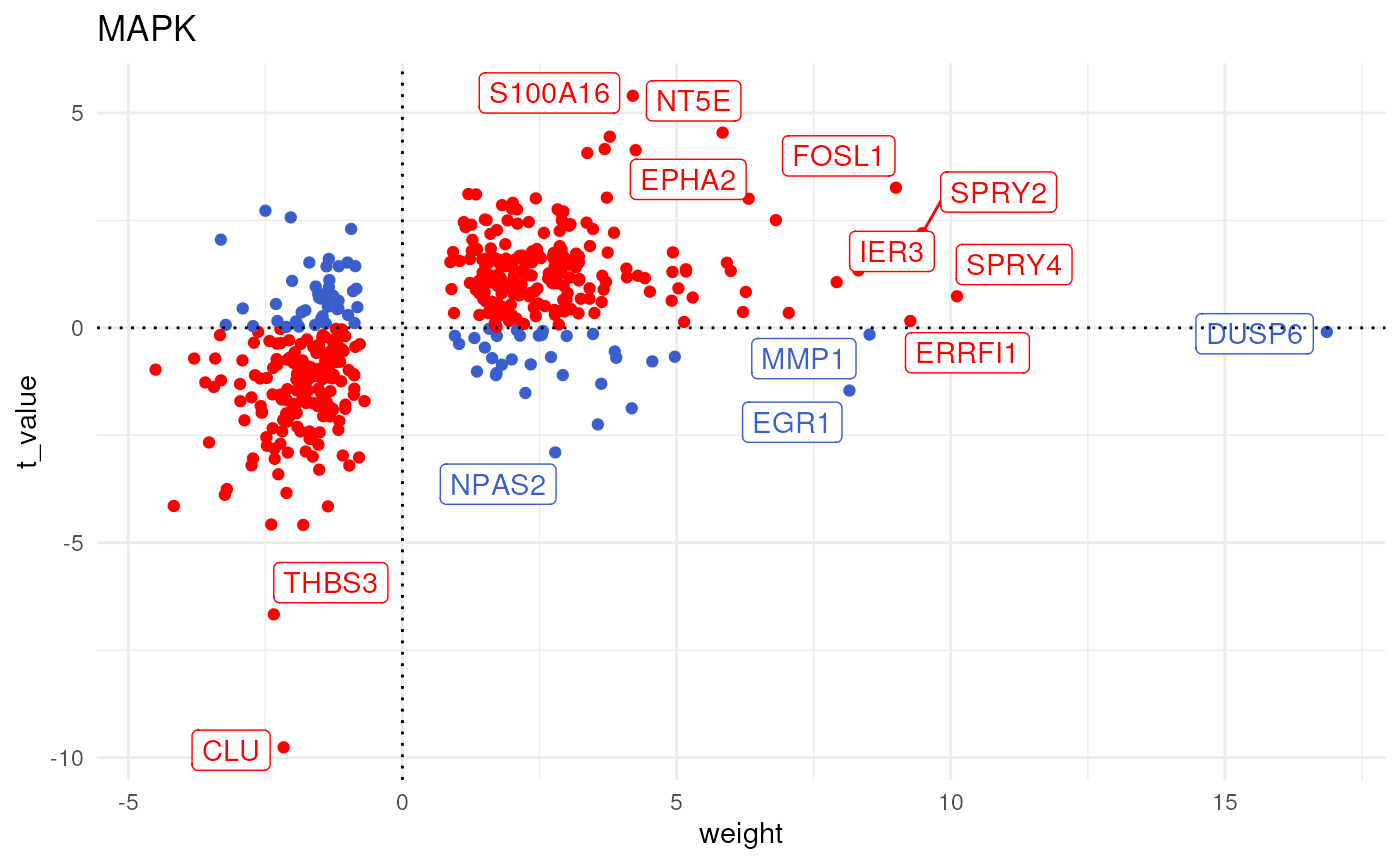
Another alternative would be to plot the weights plus the observed change per TF as shown in this vignette:
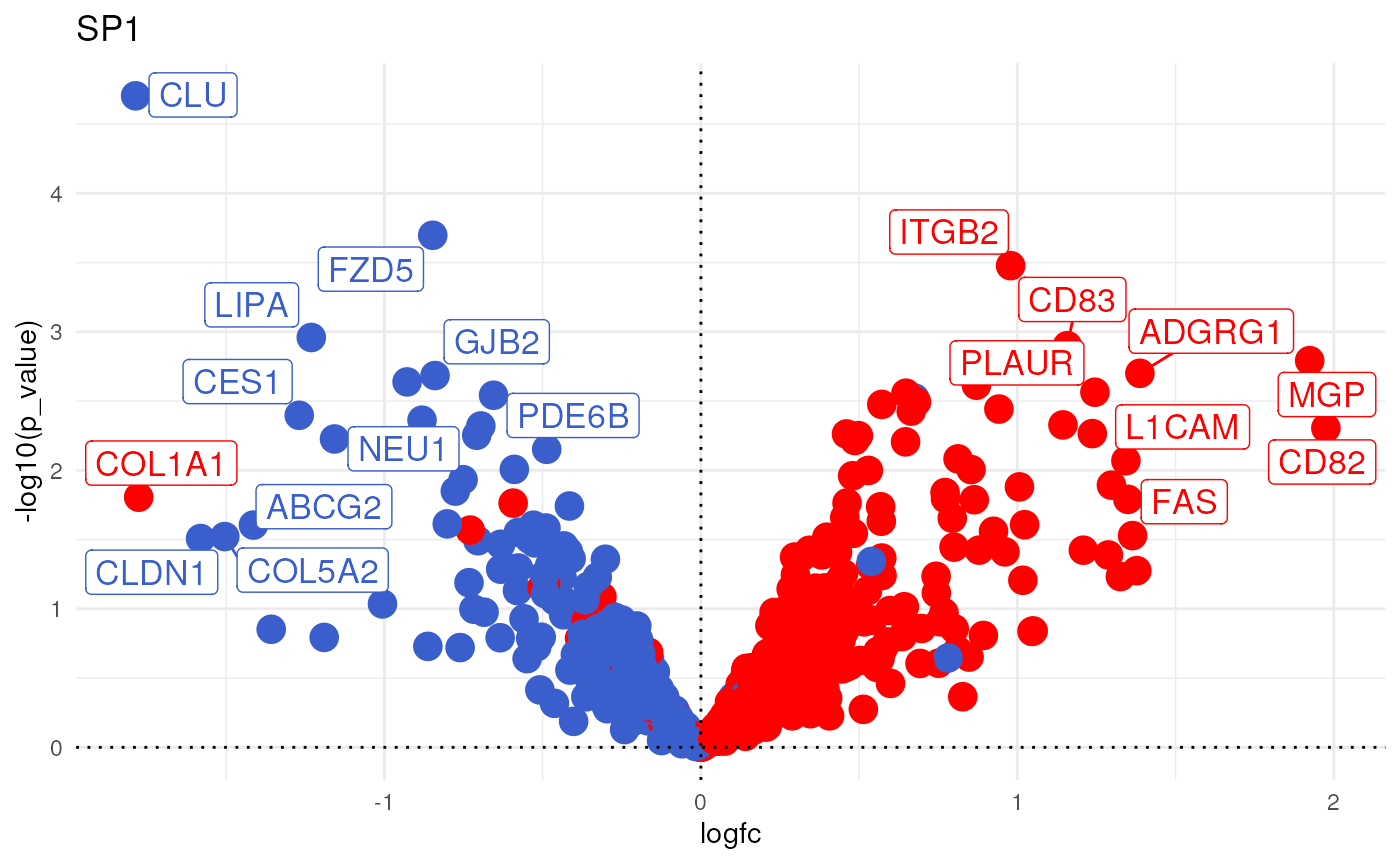
Or if you prefer it in another format look at this other vignette:
Hope this is helpful!
Hi, I used decoupleR/dorothea to analyse a one column matrix with logFC of genes from an RNA-seq experiment. I would like to build a simple heatmap with genes in rows and (highly scored) tf in columns with cells highlighted if the tf is predicted to control the gene (maybe with a scale that report the confidence/weight). How do you suggest me to proceed?