saezlab / decoupler-py

Python package to perform enrichment analysis from omics data.
https://decoupler-py.readthedocs.io/
GNU General Public License v3.0
157 stars 23 forks source link

Detection of type of alteration in each signaling pathway in each cell type #130

Closed ngvananh2508 closed 3 months ago

ngvananh2508 commented 4 months ago

Describe your question Does your library have the method can detect which signaling pathway is down or up-regulated and does it have method to define signaling pathways for each cell type instead of each cell? I saw that you library have ora and aucell methods can detect the enriched signaling pathways that appear in each cell.

Thank you very much.

PauBadiaM commented 4 months ago

Hi @ngvananh2508,

Indeed decoupler can achieve this. There are two ways on how to do it:

  1. Compute pathway activities at the single-cell level and then summarize per cell type as shown in this vignette
  2. Generate pseudobulk profiles, perform DEA and then compute activities, as shown in this other vignette.

Hope this is helpful!
ngvananh2508 commented 4 months ago

I am sorry but when I read the vignette, I dont really understand it. Now, I have an anndata with 13 cell types and 2 genders. My purpose is to compare the expression of signaling pathways between two genders in each cell type (this pathway is down or up regulated between two genders). I have some wonders:

Thank you very much for helping me!

PauBadiaM commented 4 months ago

Hi @ngvananh2508,

No problem! Since you are interested in comparing cell types based on sex, I'd recommend to just follow the pseudobulk vignette where we show how to perform functional analysis between two conditions per cell type. Regarding your questions:

In the progeny table, there is a variable called weight. Is this the coefficient of each gene expression in this pathway of a normal cell?

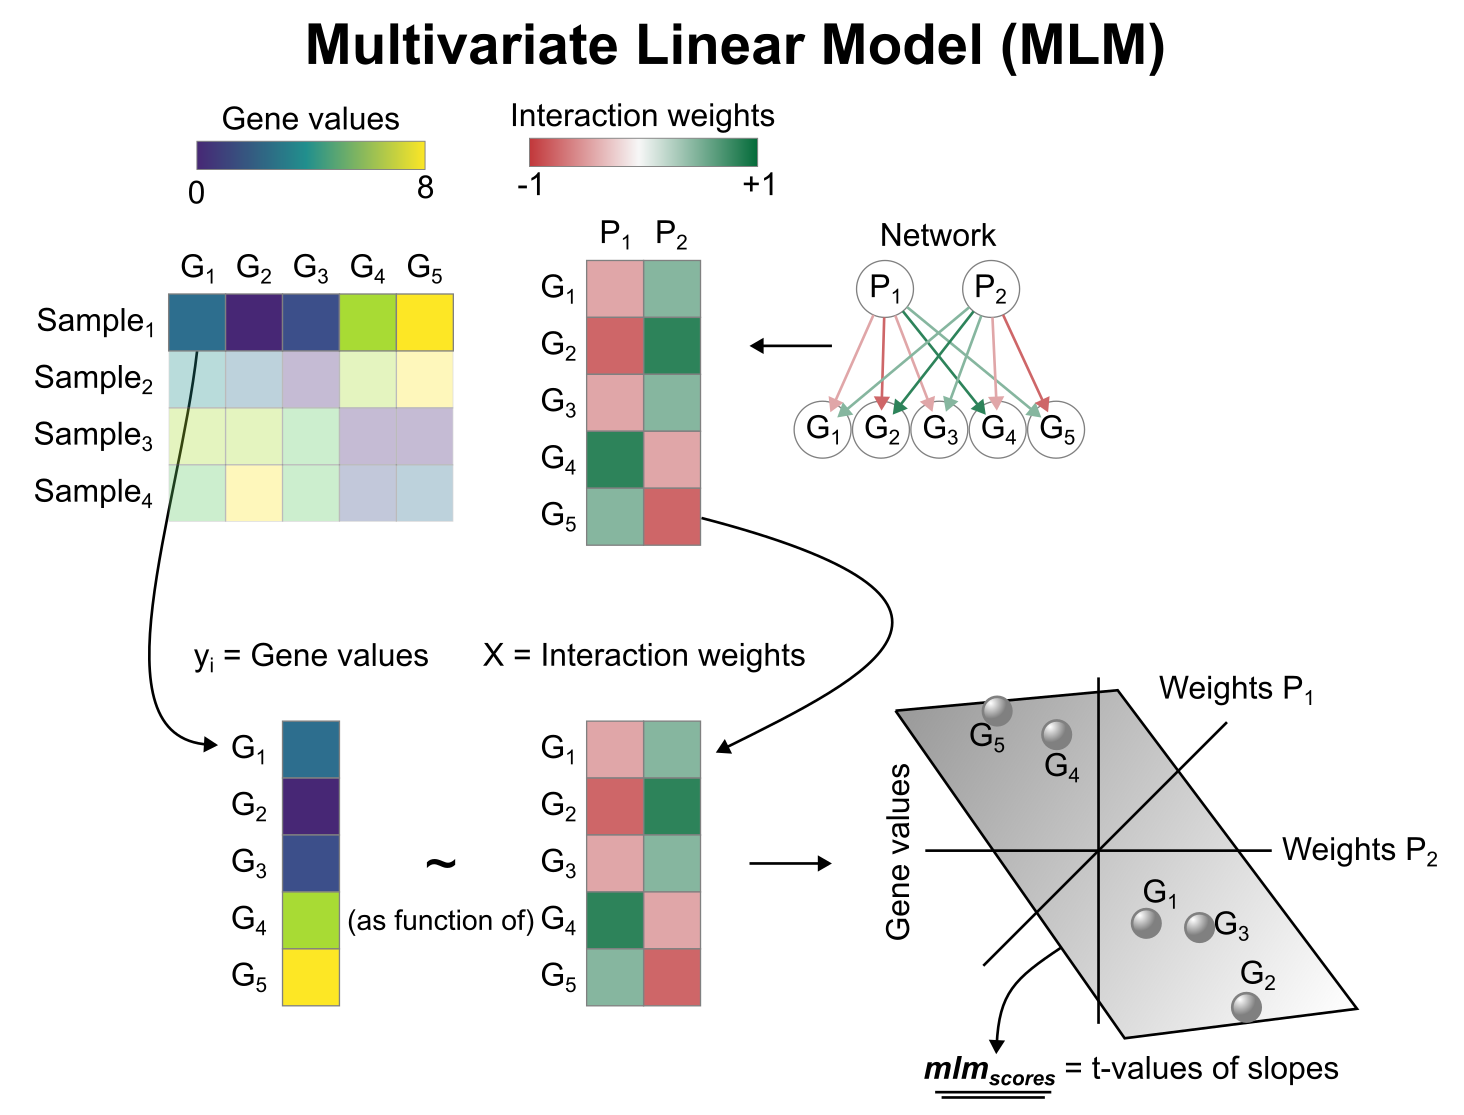
The PROGENy weights are the prior information that we have on how genes respond when each pathway is activated (they either increase or decrease their expression). These were generated by gathering multiple transcriptomic experiments where one of the pathways was experimentally activated and generating a consensus signature, more information in the original manuscript. With mlm, we fit a multivariate linear model to quantify how much your observed changes of gene expression agree with the prior we have in each pathway.

I mean that this value would be multiplied with the gene expression and sum all and compare to a threshold to define whether pathway is up or down regulated?

What you describe here is the wsum method. Instead, in mlm we predict the observed changes of gene expression (logFCs or t-values for example) with the prior that we have for each pathway.

So, in MLM model, if t-value is negative, will this pathway be down regulated?

Once the model is fitted, for each coefficient (pathway), we extract it's t-value (not to be confused with the DEA t-value) which tells us the direction of enrichment/activity (either positive or negative), and its significance (the absolute value magnitude). So if you see a pathway with a strong negative t-value, it means that the pathway is most likely inactive.

I dont really understand what differences between pathway activity inference and functional enrichment analysis are. I see that pathway activity inference can predict down or up regulated pathways if my guess is true, but ora only can indicate whether this pathway is altered or not (by the set of genes it expresses), it cannot point out the directions of this pathway (its outputs are only p-value and modification of p-value).

All of them are the same, enrichment analysis, the only difference is the interpretation of the enrichment scores and which method was used. For weighted methods such as ulm or mlm we can talk about "activities" because the obtained enrichment scores have direction (sign). On the other hand, unweighted methods such as ora or aucell can only provide positive enrichment scores so the direction of enrichment is unknown.

In the exploration part later, rank_sources_groups method is implemented, is the meanchange column in the output table is differences in the expression of this pathway compared to the rest (the meanchange positive means this pathway is up regulated compared to the rest?

If you follow the pseudobulk vignette where we generate contrast-level gene statistics (logFCs or t-values) you do not need to use the rank_sources_groups anymore. In any case, the meanchange means the difference of mean predicted activity between your group and the rest. It means that a particular pathway is, on average, more activated in the population of cells of your group than in the rest.

Hope this solves most of your questions. Do not hesitate to ask again if something is not clear or if you have any further questions ;)

ngvananh2508 commented 4 months ago

Thank you so much for you reply. I understood your all answers. I have another question related to statistical tests. Do you have any suggestions for statistical test application (i.e how can we define the test to apply for this data?) I know that the t-test is usually applied for the data having large number of samples (which can apply central limit of theorem) or data followed Gaussian distribution, Wilcoxon is more flexible for data which does not follow Gaussian dist but its statistical power is not high. But I still confuse in reality because it is quite difficult to decide the distribution of the data.

And I used rank_genes_group method (using t-test) of scanpy instead of DEseq2 to do DEA. The stat variable only exists in Wald test (because it is Wald statistic). Is any statistics of t-test equivalent to Wald statistic? Or if I want to do pathway analysis, do I have to do Wald test?

PauBadiaM commented 4 months ago

Hi @ngvananh2508,

If you use the results of deseq2 you won't need to run any other statistical test on the obtained activities since they already encode for the differences between your two conditions.

ngvananh2508 commented 3 months ago

Thank you very much for your help.