 rcavalcante
commented
4 years ago
rcavalcante
commented
4 years ago Hi,
I edited your comment above to make it a bit easier for me to read and locate the pertinent information. What I'm hearing is you ran the same data set through the old and new versions of methylSig and found:
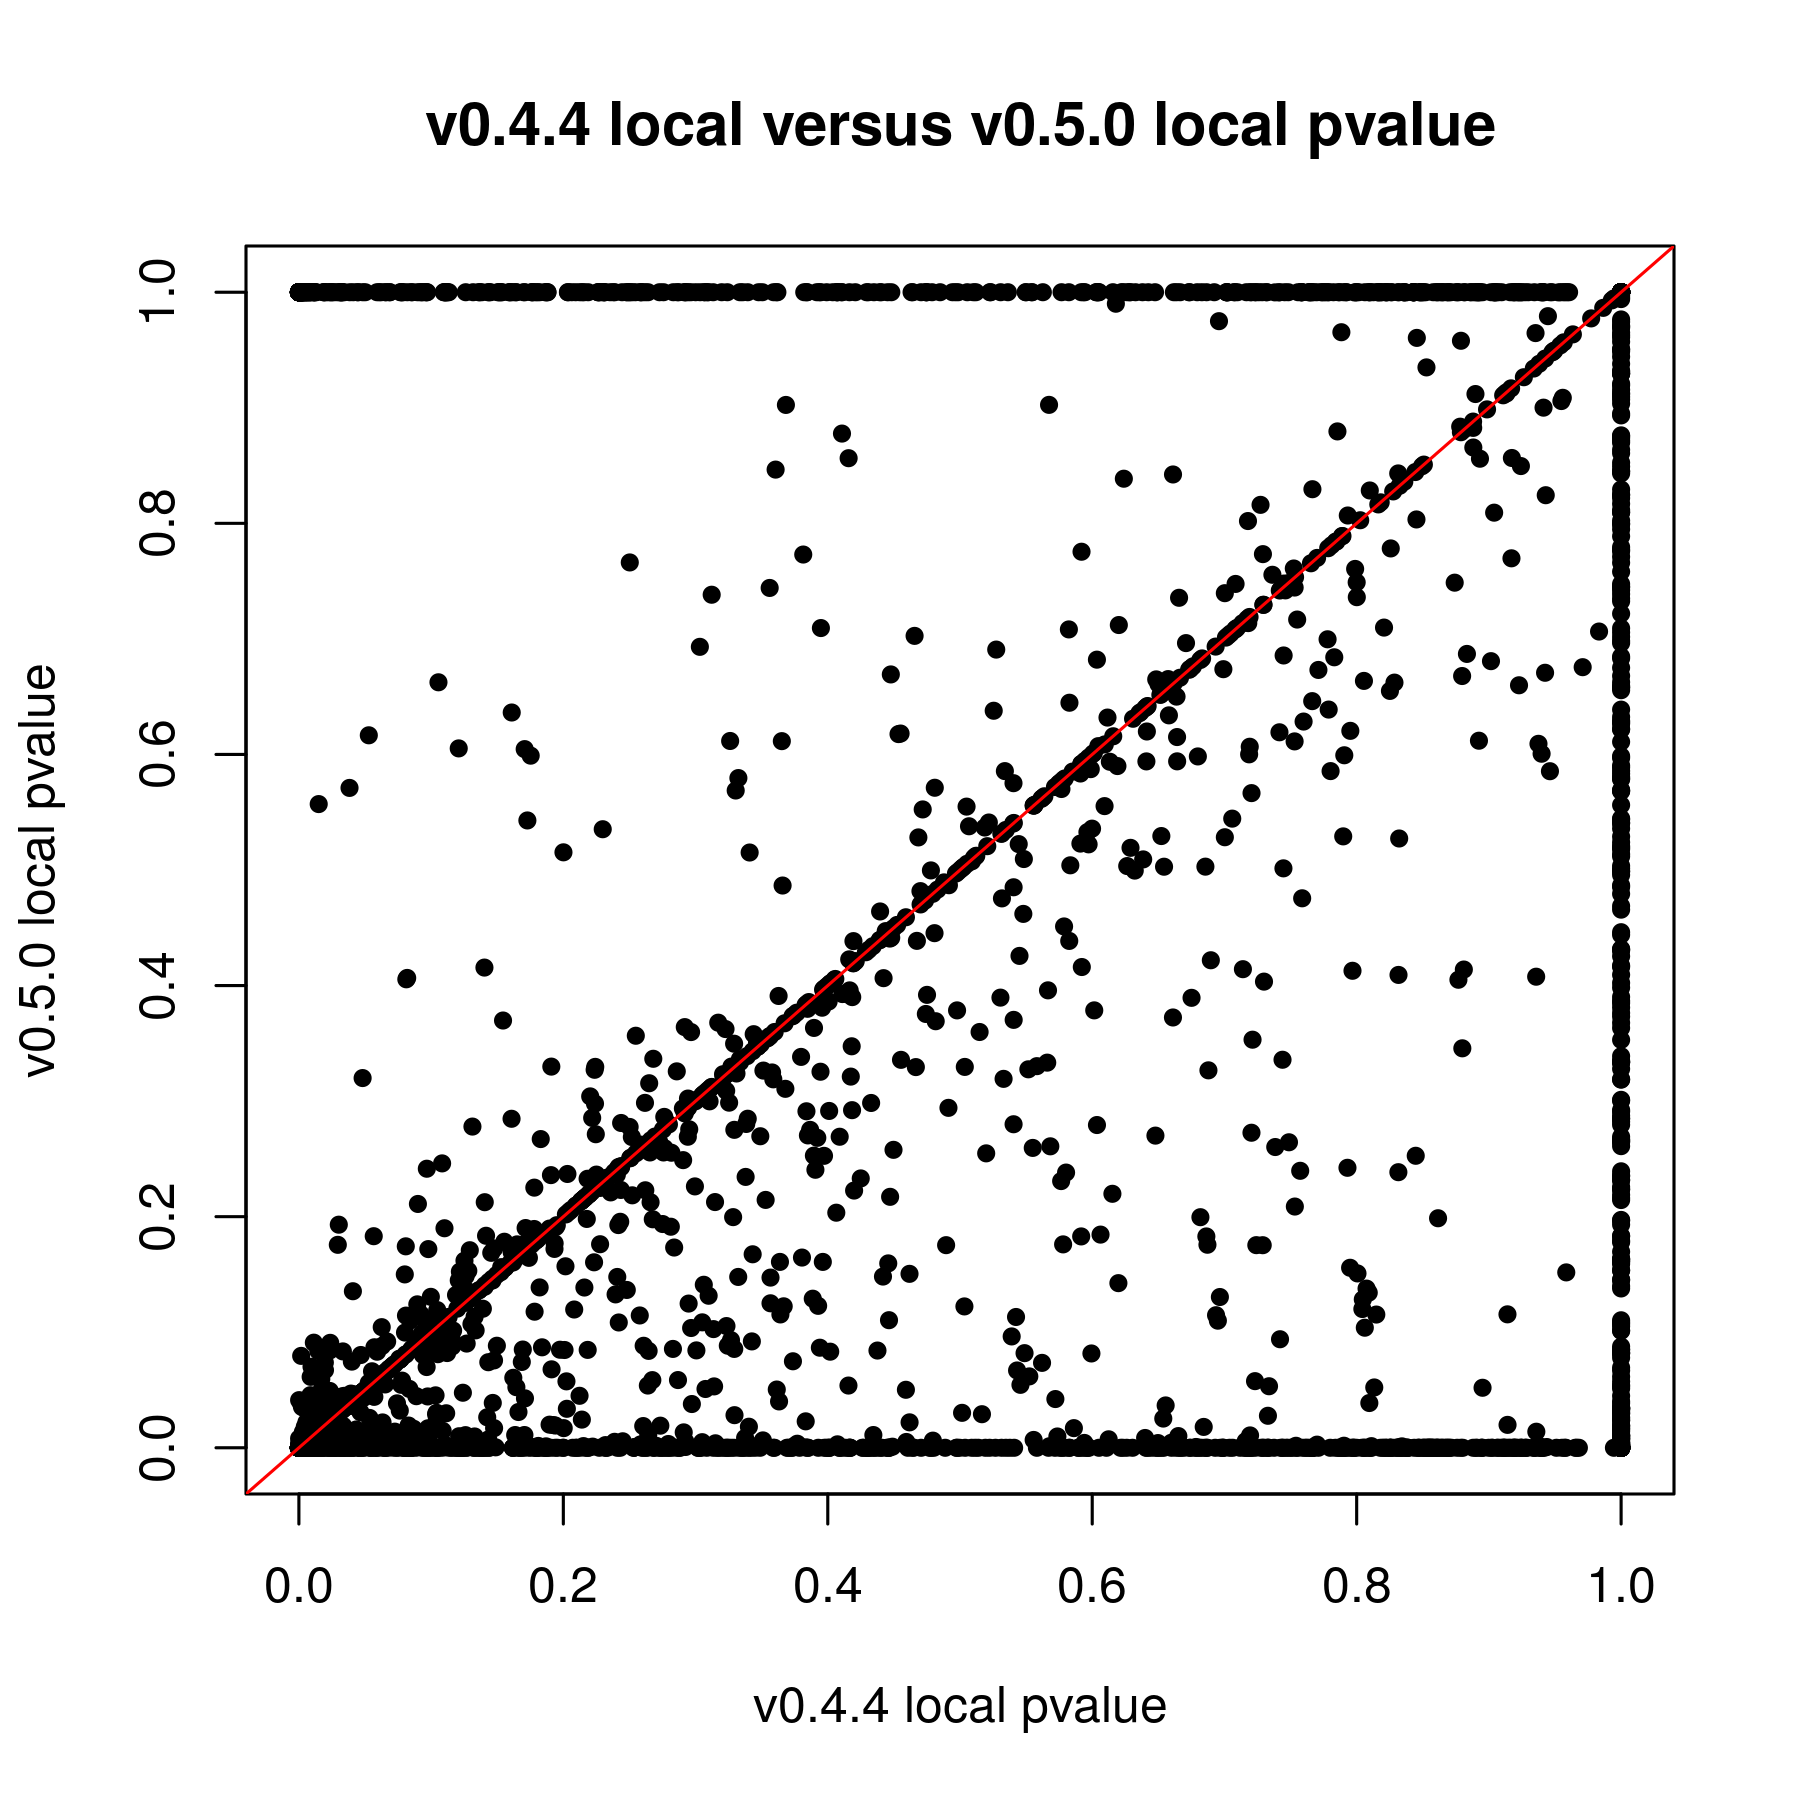
- In the old version, there are 48K loci with pval < 0.05.
- In the new version, there are 272K loci with pval < 0.05.
You also mentioned "The only thing I know that was done differently was I kept the local window size 0." Since one test used local information and the other didn't, I'm not surprised the number of significant loci are different.
The operations to compute test statistics and significance are the same, yes (you said "If it is the same test by default"), but by doing one test with local information and the other without, the numbers going into the computations are different, so you're going to get different results.
I used to set that at 200 but this doesn't seem to really work in the new version (I posted this on another issue page).
I would agree that it takes longer, and I'll try to work on that, but it does work in the sense that it uses the local information.
Are there any appropriate filtering recommendations you can make?
Some other relevant information to have would be:
- How many samples do you have total?
- How many samples per group are there?
- What min/max count filters are you using?
- Are you destranding your CpGs?
- How many samples per group are you requiring to have coverage?
In other words, it would be helpful to see the code that you're running to get the results you describe.
 shawpa
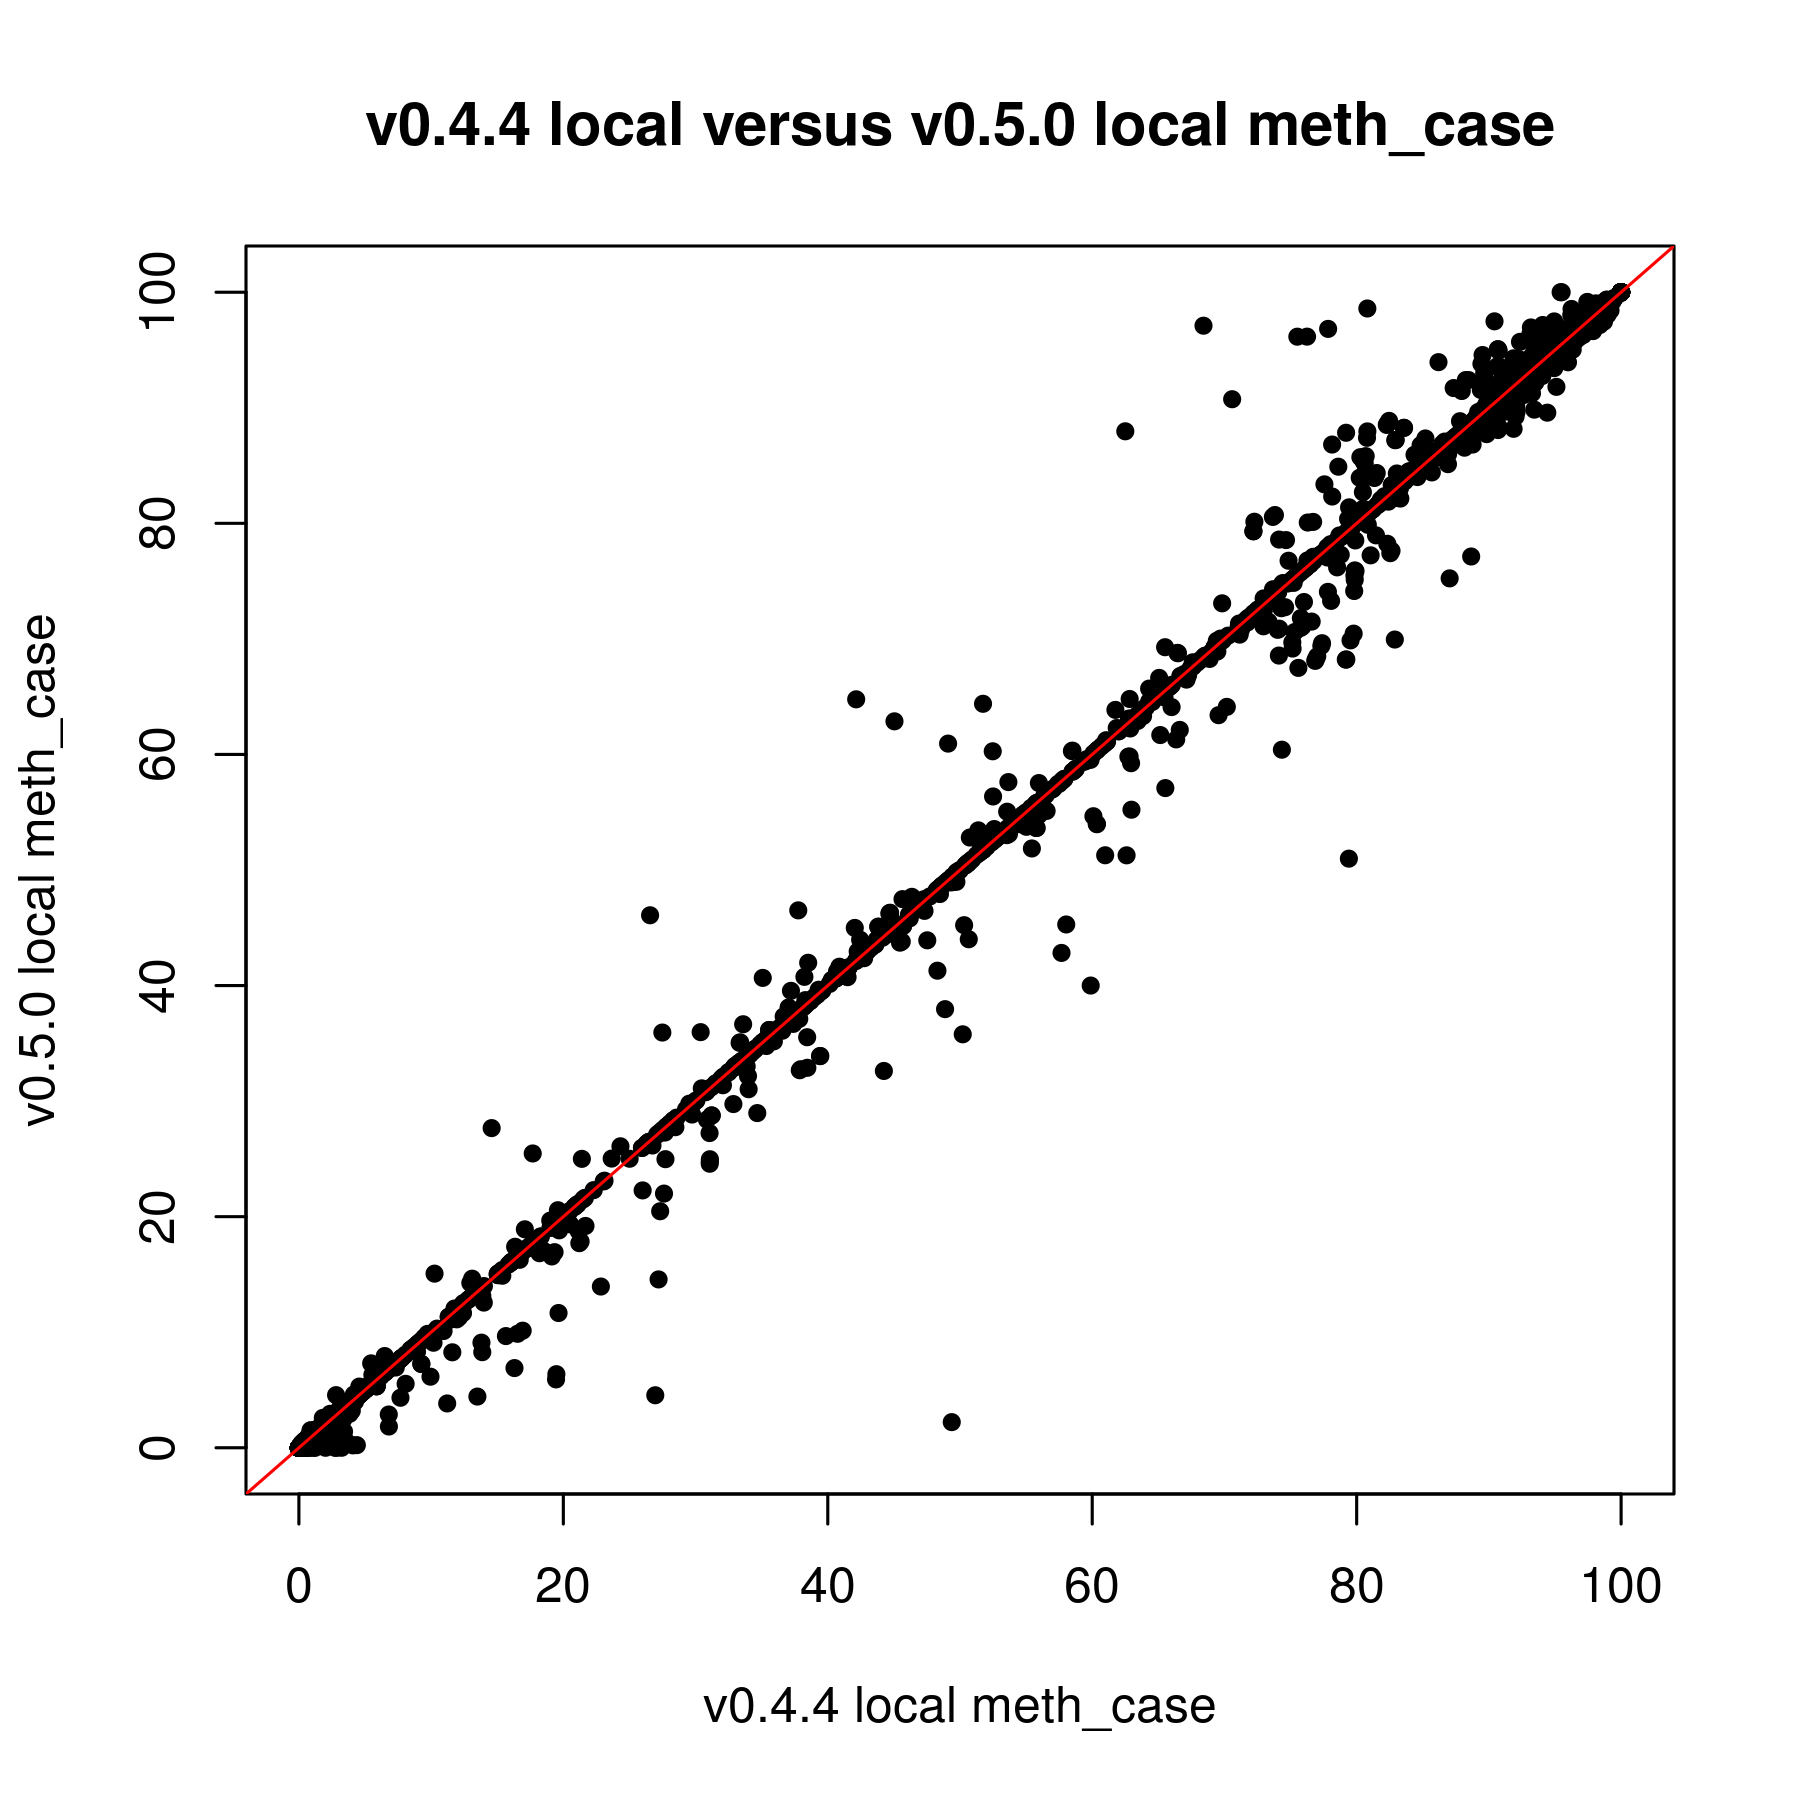
I have been trying to work with the updated version of methylSig for the last couple weeks. I was reanalyzing data that I put through the old methylSig program and I'm noticing a very large discrepancy in pvalues. My understanding is the old methylSigCalc is the the same test as diff_methylsig. I know I shouldn't be going by the pvalue but I never had sites that were q0.1 significant or less before so I just had to use the pvalue cutoff instead.
When I used the pvalue cutoff of 0.05 in the old version, I got about 48K sites. The qvalues for those sites were all 1. In the new version, I got 272K sites when I filtered for pvalue 0.05. The FDR levels off at 0.8399.
If it is the same test by default, I am not sure why there is so much discrepancy. The only thing I know that was done differently was I kept the local window size 0. I used to set that at 200 but this doesn't seem to really work in the new version (I posted this on another issue page).
Obviously I know I have a lot of false positives but I guess I have to work with what I have. Are there any appropriate filtering recommendations you can make? In the manual, it states that for a large sample size I could switch to chi2. What is a "large" sample size.