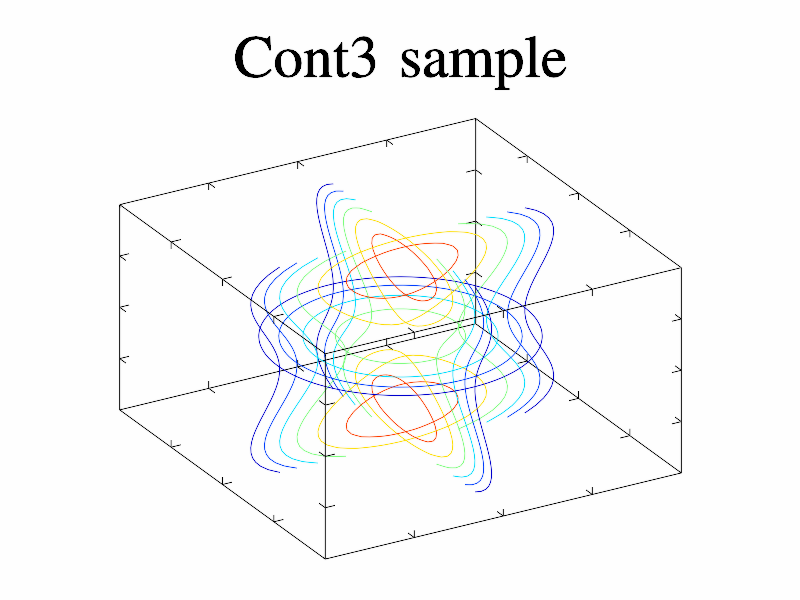
Hello, Could you please consider it? Sincerely,
Open Photonico opened 5 years ago
Hello, Could you please consider it? Sincerely,
Do you mean the "slanted" text labels or the tics?
Do you mean the "slanted" text labels or the tics?
Yes. Could you add a statement which can control whether to display "slanted" text or "normal" text? I really like GR in Python and Julia, but I don't like the "slanted" text. About tics, I think you can also make different styles. It will be great.
Sincerely,
Do you mean the "slanted" text labels or the tics?
Will you implement this function?
I could add an attribute how labels for 3d axes are displayed ...
I could add an attribute how labels for 3d axes are displayed ...
Great! This change will be thankful! When will you solve it? I want to use GR.jl in my current article.
GR is an excellent visualization solution. But I have a little dissatisfaction with the style of border and axes plotting. GR is almost perfect but I dislike its sloping tics. I prefer the style of Gnuplot, MathGL, and PGFPlot.
Could you develop it?
Gnuplot Sample:
MathGL Sample:
PGFPlot Sample:
Sincerely,