 mrocklin
commented
6 years ago
mrocklin
commented
6 years ago A microscopy dataset is available from Janelia Farm here: https://www.janelia.org/project-team/flyem/data-and-software-release , though I don't know what to do with it :)
Open mrocklin opened 6 years ago
mrocklin
commented
6 years ago A microscopy dataset is available from Janelia Farm here: https://www.janelia.org/project-team/flyem/data-and-software-release , though I don't know what to do with it :)
mrocklin
commented
6 years ago cc @jakirkham , @ebo, @freeman-lab, @jakevdp, @simone-codeluppi, @jhamman @datametrician who might know people trying to use scikit-image (or similar frameworks) in scalable contexts
 ebo
commented
6 years ago
ebo
commented
6 years ago Thank you for the CC. I will take a look at the janelia dataset.
mrocklin
commented
6 years ago @ebo to be clear I'm not asking you to look at the existing dataset listed above. Instead I'm suggesting that you might have some impact in this community-organized event if you happen to get a scalable workflow up and running before the end of May, especially if that workflow engages Scikit-Image-style computations.
I know that you're working with other Anaconda Inc folks, this might be a way to engage the broader community if that work goes as planned.
 simone-codeluppi
commented
6 years ago
simone-codeluppi
commented
6 years ago Hi
Thanks for the CC!
I have been working on a image analysis intensive project that begun as combination of HPC+MPI and then happily transitioned to dask.distributed to handle all computation. The code base (still evolving) is in the project called pysmFISH with docs at pysmFISH-docs and overall description of the project at http://linnarssonlab.org/osmFISH/. Through collaborative work I am also involved in the spatial transcriptomics community and the starfish project.
I will be very happy to get involved in this community efforts. If needed I also have some datasets that I will be happy to provide as testing case.
mrocklin
commented
6 years ago The objective of this issue is to collect datasets and computations that are representative of larger classes of computations for which people might want to use analysis that engage algorithms similar to what are found in scikit-image. If you happen to have public datasets and analyses that are simple and accessible to non-experts in your field then I encourage you to share them.
On Sun, Apr 29, 2018 at 1:18 PM, simone-codeluppi notifications@github.com wrote:
Hi Thanks for the CC! I have been working on a image analysis intensive project that begun as combination of HPC+MPI and then happily transitioned to dask.distributed to handle all computation. The code base (still evolving) is in the project called pysmFISH https://github.com/linnarsson-lab/pysmFISH with docs at pysmFISH-docs http://linnarssonlab.org/pysmFISH/ and overall description of the project at http://linnarssonlab.org/osmFISH/. Through collaborative work I am also involved in the spatial transcriptomics community and the starfish https://github.com/spacetx/starfish project. I will be very happy to get involved in this community efforts. If needed I also have some datasets that I will be happy to provide as testing case.
— You are receiving this because you authored the thread. Reply to this email directly, view it on GitHub https://github.com/scisprints/2018_05_sklearn_skimage_dask/issues/2#issuecomment-385266565, or mute the thread https://github.com/notifications/unsubscribe-auth/AASszA-oCqzcK_1iYZ-6Q-Cg_6dyB0DKks5ttfXpgaJpZM4TrmdC .
 kmader
commented
6 years ago
kmader
commented
6 years ago For larger 3d datasets, we have a few on Kaggle: https://www.kaggle.com/kmader/battery-3d-images that would be good examples and some of the standard analyse notebooks: https://www.kaggle.com/kmader/nmc-battery-3d-overview https://www.kaggle.com/kmader/battery-watershed-overview
Which are slow, cumbersome, and sometimes not fully implemented in 3D (like regionprops)
 jni
commented
6 years ago
jni
commented
6 years ago Another big(ish) dataset in the EM ecosystem:
One useful thing to do here is to lazily produce a bunch of filtered versions of the data, and concatenate these for machine learning:
(nplanes, nrows, ncolumns) -> (nplanes, nrows, ncolumns, nfilters) -> (nvoxels, nfilters) -> (da)sklearn pipeline. ;)
Of course much of this workflow has been supplanted by DL applications, but actually DL is mostly useless for live painting as done in e.g. Ilastik.
As a completely different guiding workflow for this, here's a different kind of dataset that I'm working on these days: https://data.broadinstitute.org/bbbc/BBBC017/ The ~200K images are grouped into multiple fields (tiles) and channels that need to be accumulated (this is essentially computed as 20 means of groups of ~500 images), then in a second pass need to be corrected (each image is divided by its corresponding mean illumination image), and then the results are montaged into single images. Currently I've run this using toolz streaming, which works wonderfully but takes a long time. My early attempts to daskify this pipeline blew up the memory. (@mrocklin incidentally you might remember from SciPy 2016 that my wishlist included a toolz-like interface to dask. This pipeline is why. =)
Looking forward to the sprint!!!
jni
commented
6 years ago @kmader "try_all_threshold is one whiny function" 😂 Please feel free to raise an issue with us, though!
Very very cool notebooks!
simone-codeluppi
commented
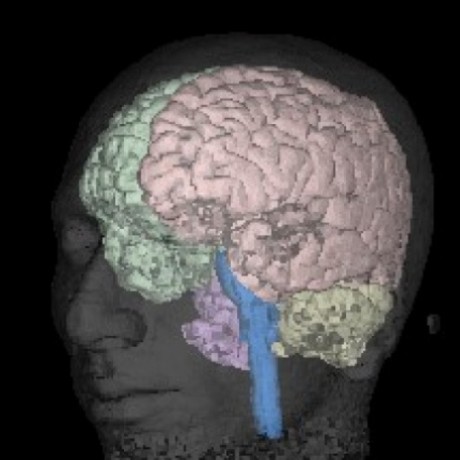
6 years ago I have a large 5Tb dataset of single molecule fluorescent images that I can split in smaller chunks. The smallest meaningful chunk to play with (~90Gb) consist of multiple FOV covering a large tissue region (220 FOV, raw images 40x2048x2048).
This will be a case study for processing high resolution fluorescence single molecule images covering a large area of thin tissue.
The images are usually low signal, low SNR and the goal is to identify single molecules that are represented by dots in the raw images. I usually run a bunch of filtering and peak selection to identify 'dots', followed by stitching, registration of multiple chunks followed by segmentation of cells using a watershed based approach. Beside the filtering everything is run on flattened images. pipeline overview We are currently trying to implement instance segmentation with R-CNN for cell segmentation and see if a similar approach can be applied to identify the dots directly from raw images without filtering.
I have a script that can process a single chuck of the dataset in 'one go' from raw data to counts (no stitching, no alignment and no segmentation). The biggest constrain is the available RAM.
 rcjackson
commented
6 years ago
rcjackson
commented
6 years ago We have around 2.5 TB of 3D grids derived from a research radar in Darwin, Australia, which will be made publicly accessible within the next month (40x200x200, around 300,000 files). One thing I am hoping to do with this data is to use recurrent CNNs to try and see if the CNN can learn how the spatial distribution of composite reflectivity (which gives us an idea of how much precipitation is falling) varies with time over the historical data to try and forecast the development and direction of new storms over the next hour. Right now this is done with tracking software, which cannot account for new development of storms within the hour, so I would like to see if this can be done without tracking software and ideally just from the raw images of composite reflectivity.
 DocSavage
commented
6 years ago
DocSavage
commented
6 years ago @mrocklin You might prefer to use the FlyEM data here: http://emdata.janelia.org While our DVID (Distributed, Versioned, Image-Oriented Dataservice) system works on a HTTP API and holds a variety of data types, the simpler DICED python interface is primarily for 3d image/segmentation access.
mrocklin
commented
6 years ago Neat project! I gave it a shot and reported feedback here: https://github.com/janelia-flyem/diced/issues/10
On Mon, Apr 30, 2018 at 3:28 PM, Bill Katz notifications@github.com wrote:
@mrocklin https://github.com/mrocklin You might prefer to use the FlyEM data here: http://emdata.janelia.org While our DVID (Distributed, Versioned, Image-Oriented Data Service) system works on a HTTP API and holds a variety of data types, the simpler DICED python interface is primarily for 3d image/segmentation access.
— You are receiving this because you were mentioned. Reply to this email directly, view it on GitHub https://github.com/scisprints/2018_05_sklearn_skimage_dask/issues/2#issuecomment-385503376, or mute the thread https://github.com/notifications/unsubscribe-auth/AASszHVeeIDHnvnCEfJ0G1-IQKGXyF81ks5tt2XkgaJpZM4TrmdC .
 westurner
commented
6 years ago
westurner
commented
6 years ago Diagnosing heart disease from DICOM MRI images https://www.kaggle.com/c/second-annual-data-science-bowl/data
In this dataset, you are given hundreds of cardiac MRI images in DICOM format. These are 2D cine images that contain approximately 30 images across the cardiac cycle. Each slice is acquired on a separate breath hold. This is important since the registration from slice to slice is expected to be imperfect.
The competition task is to create an automated method capable of determining the left ventricle volume at two points in time: after systole, when the heart is contracted and the ventricles are at their minimum volume, and after diastole, when the heart is at its largest volume.
westurner
commented
6 years ago Diagnosing lung cancer from DICOM CT images https://www.kaggle.com/c/data-science-bowl-2017/data
In this dataset, you are given over a thousand low-dose CT images from high-risk patients in DICOM format. Each image contains a series with multiple axial slices of the chest cavity. Each image has a variable number of 2D slices, which can vary based on the machine taking the scan and patient.
The DICOM files have a header that contains the necessary information about the patient id, as well as scan parameters such as the slice thickness.
The competition task is to create an automated method capable of determining whether or not the patient will be diagnosed with lung cancer within one year of the date the scan was taken. The ground truth labels were confirmed by pathology diagnosis.
westurner
commented
6 years ago awesome-public-datasets has a bunch of image datasets: https://github.com/awesomedata/awesome-public-datasets
https://github.com/awesomedata/awesome-public-datasets/blob/master/README.rst#imageprocessing
kmader
commented
6 years ago Perhaps this is out of scope for the sprint but it is currently significantly easier to build a neural network in keras for image classification or segmentation than sklearn. I have a few examples here of how to use sklearn pipelines with some manual transformers and fit functions but it would be great if it were as easy in sklearn with decision trees as it is in keras.
Classification of Images with knearestneighbors: http://nbviewer.jupyter.org/github/kmader/Quantitative-Big-Imaging-2018/blob/master/Lectures/05-SupervisedApproaches.ipynb#Classification
Segmentation with decision trees http://nbviewer.jupyter.org/github/kmader/Quantitative-Big-Imaging-2018/blob/master/Lectures/05-SupervisedApproaches.ipynb#Include-Position-Information
 rmsare
commented
6 years ago
rmsare
commented
6 years ago Thanks for this. I'm interested in using dask for scalable analysis/modeling of topographic data and satellite imagery for Earth science applications. There might be enough cross-over with other application areas in remote sensing to make this worth pursuing.
This usually involves distribut-able image processing operations for computing gradient, curvature, or other derivative quantities, or differencing for change detection between acquisitions.
Existing projects like landlab implement a lot of this functionality with numpy only.
Examples of more complex tasks are segmenting/tracking landscape features like river channels or routing flow over elevation grids.
There aren't a lot of benchmarks or challenges directly related to topographic data, but there are many public data sources. e.g.:
Elevation data has the advantage of often being served as tiled rasters which makes distributing operations that might require neighboring tiles a little easier. Same for computations that might be better performed at a certain resolution/zoom level, or sequence of zoom levels. This could make it an interesting dask use case compared to workflows that operate on individual, independent images from a large set.
Deep learning was mentioned above, and interest in DL applications for satellite imagery has spawned quite a few challenges like:
Maybe some of these data could be adapted for a dask-ified segmentation or feature detection task?
 rabernat
commented
6 years ago
rabernat
commented
6 years ago @tjcrone has recently created an amazing image dataset based on the OOI CamHD video. He might have some examples to suggest here.
 jakirkham
commented
6 years ago
jakirkham
commented
6 years ago Another option for imaging data is Neurofinder, which has some curated Calcium Imaging datasets with ground truth. This project was setup as part of a competition. So different algorithms are benchmarked and ranked in the leaderboard. Some of which contain references about how a particular algorithm was run.
jakirkham
commented
6 years ago Also just a side note (a little off topic), there has been some discussion in issue ( https://github.com/dask/dask/issues/3111 ) about pulling together different pieces of existing work using Dask for image processing into a project called dask-image. Mentioning it here in case this is of interest to anyone.
Edit: Broke this out as issue ( https://github.com/scisprints/2018_05_sklearn_skimage_dask/issues/11 ).
mrocklin
commented
6 years ago Thanks for the examples all!
The Neurofinder project looks especially nice to me. It has a clear dataset that is easy to access and well explained. There is a clear problem to solve that is accessible to non-experts. And there are several implementations to compare to. Nice.
 emmanuelle
commented
6 years ago
emmanuelle
commented
6 years ago The tutorial I wrote on tomography image segmentation http://emmanuelle.github.io/segmentation-of-3-d-tomography-images-with-python-and-scikit-image.html is a bit outdated (the link to the data is broken but I will update it) but it's a good example of a typical workflow for materials science tomography images.
Any advice on where to put an open data set?
mrocklin
commented
6 years ago I tend to put things in Google Cloud Storage buckets. It's pretty easy to make them publicly downloadable.
Setting up accounts on a cloud storage system may be overkill for something like this though. It looks like it will be around 50MB in size? Maybe just a git repository?
On Fri, May 18, 2018 at 5:12 PM, Emmanuelle Gouillart < notifications@github.com> wrote:
The tutorial I wrote on tomography image segmentation http://emmanuelle.github.io/segmentation-of-3-d- tomography-images-with-python-and-scikit-image.html is a bit outdated (the link to the data is broken but I will update it) but it's a good example of a typical workflow for materials science tomography images.
Any advice on where to put an open data set?
— You are receiving this because you were mentioned. Reply to this email directly, view it on GitHub https://github.com/scisprints/2018_05_sklearn_skimage_dask/issues/2#issuecomment-390333784, or mute the thread https://github.com/notifications/unsubscribe-auth/AASszBqDFw5ikg5iHheT6PCcqY1IZb8wks5tzzlCgaJpZM4TrmdC .
emmanuelle
commented
6 years ago @mrocklin thanks! I can put the image (~200 Mo) on my server, but I wanted to know whether there was something more sustainable.
Regarding user problems: as a user, what I'm mostly interested in is accelerating some functions (especially bottleneck ones) by benefiting from a multicore implementation. Can we gain a x10 speed factor on a machine by using 10 cores? (even a x5 factor would be good!). At the moment I'm doing it "by hand" like in this gist https://gist.github.com/emmanuelle/91db4a366496ecb13693c8b513235c55
jakirkham
commented
6 years ago One of the participants at the ImageXD conference offered to share their data. It’s 3-D X-Ray Tomography data (+time) of fiber bundles. Interests in this data includes identification of crack formation, tracking fiber movement, image registration, etc. Some of it lives in the Google Drive linked below. Expect we can get more if there’s interest.
Ref: https://drive.google.com/drive/folders/1vLhv4iFleESxue3Ca3DYHYjbIQsShYCj?usp=sharing
jni
commented
6 years ago @emmanuelle, re persistent data sharing, I recently used https://osf.io/ for my PeerJ skan paper. It’s pretty great for archival (DOI).
westurner
commented
6 years ago From https://en.wikipedia.org/wiki/Registry_of_Research_Data_Repositories :
https://www.re3data.org is a global registry of research data repositories from all academic disciplines. It provides an overview of existing research data repositories in order to help researchers to identify a suitable repository for their data and thus comply with requirements set out in data policies.
With the schema.org RDFS vocabulary, dataset metadata can be expressed with schema.org/Dataset and schema.org/DataCatalog so that search engines and other tools can identify it.
On Friday, May 18, 2018, Emmanuelle Gouillart notifications@github.com wrote:
The tutorial I wrote on tomography image segmentation http://emmanuelle.github.io/segmentation-of-3-d- tomography-images-with-python-and-scikit-image.html is a bit outdated (the link to the data is broken but I will update it) but it's a good example of a typical workflow for materials science tomography images.
Any advice on where to put an open data set?
— You are receiving this because you commented. Reply to this email directly, view it on GitHub https://github.com/scisprints/2018_05_sklearn_skimage_dask/issues/2#issuecomment-390333784, or mute the thread https://github.com/notifications/unsubscribe-auth/AADGy5CBiSyV2wG-cZeXitF7pc7NA9iiks5tzzlDgaJpZM4TrmdC .
In order to make the most of our time at the scaling scikit-image sprint it might be helpful to prepare some challenge problems and datasets that we want to focus on before we arrive. Ideally these datasets and problems have the following qualities:
An equivalent issue for machine learning datasets is posed at #1