 asmlgkj
commented
3 weeks ago
asmlgkj
commented
3 weeks ago Thaks a lot. I found it hard for a new learner to use the downloaded data, can there be a new tutorial start from the downloaded data, not the inner function.
tutotial lin is https://squidpy.readthedocs.io/en/stable/notebooks/tutorials/tutorial_visium_hne.html
import pandas as pd import os import matplotlib.pyplot as plt
import anndata as ad import scanpy as sc import squidpy as sq import tifffile as tiff sc.logging.print_header() adata = ad.read_h5ad('visium_hne.h5ad') img = tiff.imread('visium_hne.tiff') library_id = list(adata.uns['spatial'])[0] adata.uns['spatial'][library_id]['images'] = {'hires': img}
sq.pl.spatial_scatter(adata, color="cluster")
img_ml = sq.im.ImageContainer(img) for scale in [1.0, 2.0]: feature_name = f"features_summary_scale{scale}" sq.im.calculate_image_features( adata, img_ml, features="summary", key_added=feature_name, n_jobs=4, scale=scale, ) adata.obsm["features"] = pd.concat( [adata.obsm[f] for f in adata.obsm.keys() if "features_summary" in f], axis="columns", ) adata.obsm["features"].columns = ad.utils.make_index_unique( adata.obsm["features"].columns )
helper function returning a clustering
def cluster_features(features: pd.DataFrame, like=None) -> pd.Series: """ Calculate leiden clustering of features.
Specify filter of features using `like`.
"""
# filter features
if like is not None:
    features = features.filter(like=like)
# create temporary adata to calculate the clustering
adata = ad.AnnData(features)
# important - feature values are not scaled, so need to scale them before PCA
sc.pp.scale(adata)
# calculate leiden clustering
sc.pp.pca(adata, n_comps=min(10, features.shape[1] - 1))
sc.pp.neighbors(adata)
sc.tl.leiden(adata)

return adata.obs["leiden"]
calculate feature clusters
adata.obs["features_cluster"] = cluster_features(adata.obsm["features"], like="summary")
compare feature and gene clusters
sq.pl.spatial_scatter(adata, color=["features_cluster", "cluster"])
 LLehner
 giovp
giovp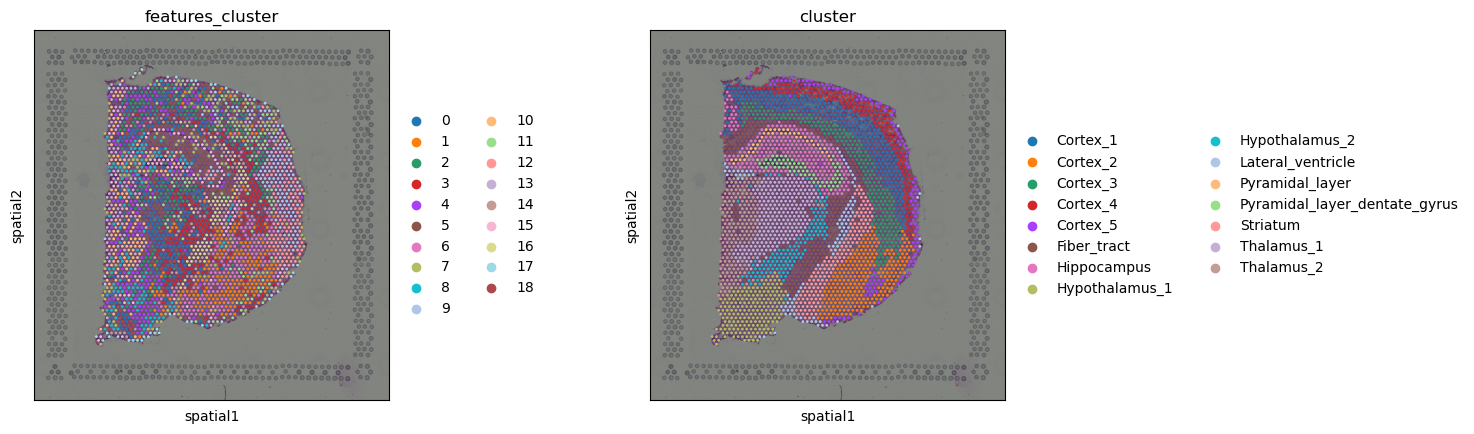
Description
due to the server network, I can not run img = sq.datasets.visium_hne_image() adata = sq.datasets.visium_hne_adata()
so I downloaded the visium_fluo.h5ad on another computer and uploaded it to the server. I tried to split the data into image and adata, but
import pandas as pd import os import matplotlib.pyplot as plt
import anndata as ad import scanpy as sc import squidpy as sq
sc.logging.print_header() print(f"squidpy=={sq.version}") adata = sc.read_h5ad('visium_fluo.h5ad') img = adata.uns['spatial']['V1_Adult_Mouse_Brain_Coronal_Section_2']['images']['hires']
but the following code failed img.show(channelwise=True) ttributeError: 'numpy.ndarray' object has no attribute 'show'
how can I reproduce the tutorial on the downlaoded data
thanks a lot ...
Minimal reproducible example
Version
...