 myeonggyukim0513
commented
1 month ago
myeonggyukim0513
commented
1 month ago I solved the problem by installing previous version (0.44.1)
Closed myeonggyukim0513 closed 1 month ago
myeonggyukim0513
commented
1 month ago I solved the problem by installing previous version (0.44.1)
Issue Description
I ran the same code to reproduce the SHAP summary plot for the 3-group classification that I ran before. However, instead of the bar graph for the 3 groups, an interaction plot has been appearing for the past few days. Has there been any change in the source code?
Below is my code for SHAP plot.
explainer = shap.TreeExplainer(model)
shap_values = explainer.shap_values(X)
shap.summary_plot(shap_values, X, plot_type="bar", class_names=['Cat1', 'Cat2','NC+Cat3'], class_inds='original')
Previous result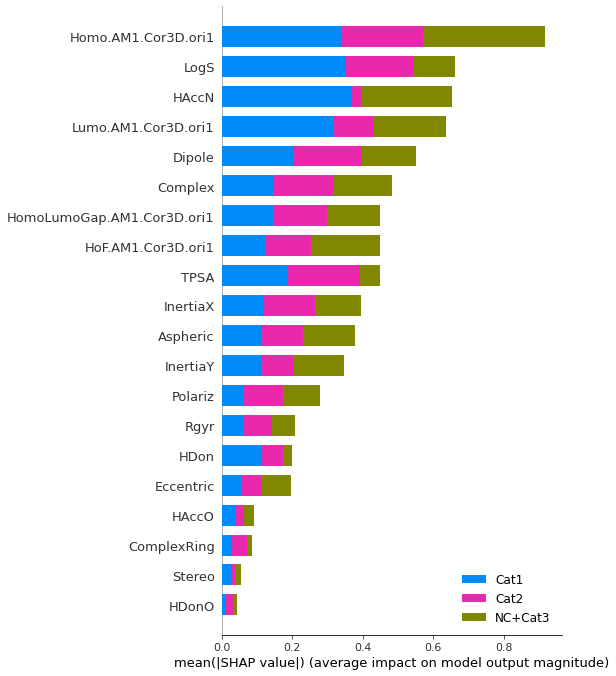
Now,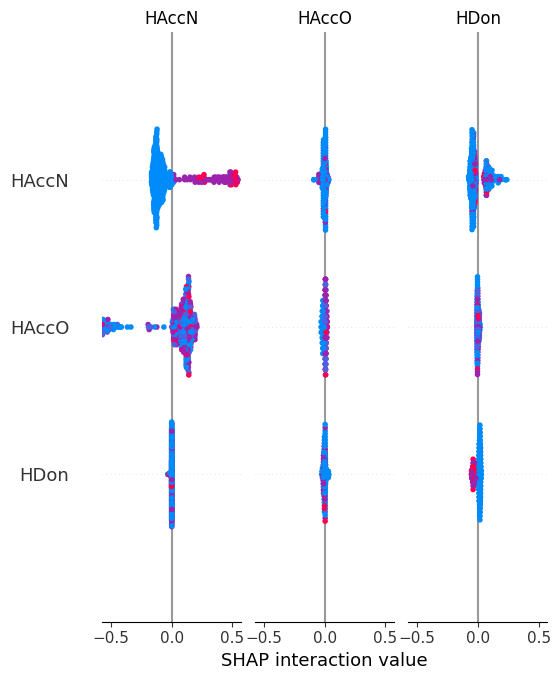
Minimal Reproducible Example
Traceback
No response
Expected Behavior
No response
Bug report checklist
Installed Versions
latest version (google Colab install)