slowkow / ggrepel

:round_pushpin: Repel overlapping text labels away from each other in your ggplot2 figures.
https://ggrepel.slowkow.com
GNU General Public License v3.0
1.21k stars 95 forks source link

Duplicate text labels after ggbreak #244

Closed willizhang closed 8 months ago

willizhang commented 9 months ago

Hi,

Thank you very much for this nice package. I am trying to draw some plots but come across two issues:

library(ggalluvial)
library(ggplot2)
library(ggrepel)
library(ggbreak)

titanic_wide <- data.frame(Titanic)
titanic_long <- to_lodes_form(titanic_wide, axes = 1:4,
                              key = "variable", value = "value", id = "cohort",
                              diffuse = Class)

ggplot(
  data = titanic_long,
  aes(x = variable, stratum = value, alluvium = cohort, y = Freq)
) +
  geom_alluvium(aes(fill=Class)) +
  geom_stratum(aes(fill=Class)) +
  scale_y_break( c( 50, 500 ), scales = 10, space = 0.3 ) +
  geom_text(stat = "stratum", aes(label = after_stat(stratum)) ) +
  theme_minimal() +
  ggtitle(
    "passengers on the maiden voyage of the Titanic",
    "stratified by demographics and survival"
  )+
  scale_fill_manual(
    values=c("red","orange","green","blue"),
    breaks=c("1st","2nd","3rd","Crew"),
    labels=c("1st","2nd","3rd","Crew"),
    na.value = NA,
    aesthetics = c("fill", "color")
  ) +
  geom_text_repel(stat = "alluvium",
                  aes(x = as.integer(variable) + 0.15,
                      color = Class,
                      label = ifelse(variable == "Survived" & Freq >= 10, Freq, NA)),
                  direction = "y", nudge_x = .5,
                  point.padding = 0,
                  hjust = "left")

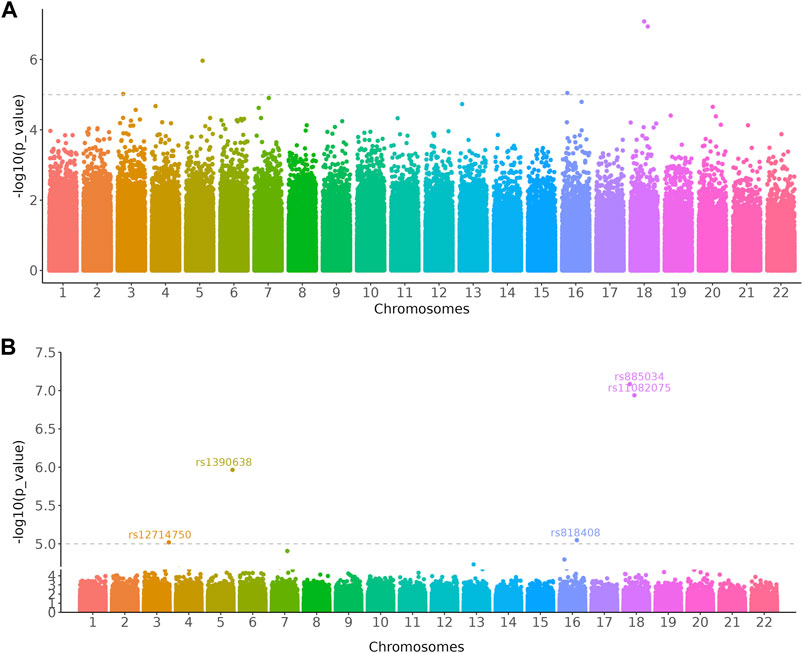
Here is an image of the output produced by the code:

image

Thank you very much in advance for your time and help!

Best regards, Willi

slowkow commented 9 months ago

Hi Willi, thanks for opening an issue.

It seems like ggrepel and ggbreak are not compatible with each other.

I would be happy to review a pull request if someone wants to attempt to make ggrepel compatible with ggbreak (or any other packages).

As far as I can tell, the issue is that ggbreak duplicates the data: the upper gets a full copy of the data and the lower panels get a full copy of the data. Instead, each panel should get the subset of the data that belongs to that panel.

This makes me think the issue is in the ggbreak code, not in the ggrepel code. I might be mistaken.

The code in the previous post is not minimal. The alluvial plot is unnecessary to show the incompatibility between ggbreak and ggrepel. Below, there is a much simpler example that demonstrates the issue:

library(ggrepel)
#> Loading required package: ggplot2
library(ggbreak)
#> ggbreak v0.1.2
#> 
#> If you use ggbreak in published research, please cite the following
#> paper:
#> 
#> S Xu, M Chen, T Feng, L Zhan, L Zhou, G Yu. Use ggbreak to effectively
#> utilize plotting space to deal with large datasets and outliers.
#> Frontiers in Genetics. 2021, 12:774846. doi: 10.3389/fgene.2021.774846

p <- ggplot(mtcars, aes(wt, mpg, label = rownames(mtcars))) +
  geom_text_repel() +
  geom_point(color = 'red') +
  theme_classic(base_size = 16)

p
#> Warning: ggrepel: 2 unlabeled data points (too many overlaps). Consider
#> increasing max.overlaps


p + scale_y_break(c(15, 25))

Created on 2023-12-02 with reprex v2.0.2

Session info ``` r sessioninfo::session_info() #> ─ Session info ─────────────────────────────────────────────────────────────── #> setting value #> version R version 4.2.3 (2023-03-15) #> os macOS Ventura 13.4 #> system aarch64, darwin20 #> ui X11 #> language (EN) #> collate en_US.UTF-8 #> ctype en_US.UTF-8 #> tz America/New_York #> date 2023-12-02 #> pandoc 3.1.1 @ /Applications/RStudio.app/Contents/Resources/app/quarto/bin/tools/ (via rmarkdown) #> #> ─ Packages ─────────────────────────────────────────────────────────────────── #> package * version date (UTC) lib source #> aplot 0.2.2 2023-10-06 [1] CRAN (R 4.2.0) #> cachem 1.0.8 2023-05-01 [1] CRAN (R 4.2.0) #> cli 3.6.1 2023-03-23 [1] CRAN (R 4.2.0) #> colorspace 2.1-0 2023-01-23 [1] CRAN (R 4.2.0) #> curl 5.1.0 2023-10-02 [1] CRAN (R 4.2.0) #> digest 0.6.31 2022-12-11 [1] CRAN (R 4.2.0) #> dplyr 1.1.2 2023-04-20 [1] CRAN (R 4.2.0) #> evaluate 0.21 2023-05-05 [1] CRAN (R 4.2.0) #> fansi 1.0.4 2023-01-22 [1] CRAN (R 4.2.0) #> farver 2.1.1 2022-07-06 [1] CRAN (R 4.2.0) #> fastmap 1.1.1 2023-02-24 [1] CRAN (R 4.2.0) #> fs 1.6.2 2023-04-25 [1] CRAN (R 4.2.0) #> generics 0.1.3 2022-07-05 [1] CRAN (R 4.2.0) #> ggbreak * 0.1.2 2023-06-26 [1] CRAN (R 4.2.0) #> ggfun 0.1.3 2023-09-15 [1] CRAN (R 4.2.0) #> ggplot2 * 3.4.2 2023-04-03 [1] CRAN (R 4.2.0) #> ggplotify 0.1.2 2023-08-09 [1] CRAN (R 4.2.0) #> ggrepel * 0.9.4 2023-10-13 [1] CRAN (R 4.2.0) #> glue 1.6.2 2022-02-24 [1] CRAN (R 4.2.0) #> gridGraphics 0.5-1 2020-12-13 [1] CRAN (R 4.2.0) #> gtable 0.3.3 2023-03-21 [1] CRAN (R 4.2.0) #> highr 0.10 2022-12-22 [1] CRAN (R 4.2.0) #> htmltools 0.5.5 2023-03-23 [1] CRAN (R 4.2.0) #> knitr 1.43 2023-05-25 [1] CRAN (R 4.2.0) #> labeling 0.4.2 2020-10-20 [1] CRAN (R 4.2.0) #> lifecycle 1.0.3 2022-10-07 [1] CRAN (R 4.2.0) #> magrittr 2.0.3 2022-03-30 [1] CRAN (R 4.2.0) #> memoise 2.0.1 2021-11-26 [1] CRAN (R 4.2.0) #> munsell 0.5.0 2018-06-12 [1] CRAN (R 4.2.0) #> patchwork 1.1.2 2022-08-19 [1] CRAN (R 4.2.0) #> pillar 1.9.0 2023-03-22 [1] CRAN (R 4.2.0) #> pkgconfig 2.0.3 2019-09-22 [1] CRAN (R 4.2.0) #> R6 2.5.1 2021-08-19 [1] CRAN (R 4.2.0) #> Rcpp 1.0.10 2023-01-22 [1] CRAN (R 4.2.0) #> reprex 2.0.2 2022-08-17 [1] CRAN (R 4.2.0) #> rlang 1.1.1 2023-04-28 [1] CRAN (R 4.2.0) #> rmarkdown 2.23 2023-07-01 [1] CRAN (R 4.2.0) #> rstudioapi 0.15.0 2023-07-07 [1] CRAN (R 4.2.0) #> scales 1.2.1 2022-08-20 [1] CRAN (R 4.2.0) #> sessioninfo 1.2.2 2021-12-06 [1] CRAN (R 4.2.0) #> tibble 3.2.1 2023-03-20 [1] CRAN (R 4.2.0) #> tidyselect 1.2.0 2022-10-10 [1] CRAN (R 4.2.0) #> utf8 1.2.3 2023-01-31 [1] CRAN (R 4.2.0) #> vctrs 0.6.3 2023-06-14 [1] CRAN (R 4.2.3) #> withr 2.5.0 2022-03-03 [1] CRAN (R 4.2.0) #> xfun 0.39 2023-04-20 [1] CRAN (R 4.2.0) #> xml2 1.3.4 2023-04-27 [1] CRAN (R 4.2.0) #> yaml 2.3.7 2023-01-23 [1] CRAN (R 4.2.0) #> yulab.utils 0.1.0 2023-09-20 [1] CRAN (R 4.2.0) #> #> [1] /Library/Frameworks/R.framework/Versions/4.2-arm64/Resources/library #> #> ────────────────────────────────────────────────────────────────────────────── ```
willizhang commented 9 months ago

Many thanks! :)

slowkow commented 9 months ago

I quickly scanned the ggbreak paper and vignette.

I found one example in Figure 3 that uses text labels to annotate data points. After playing around a bit, I have an inkling that they used geom_text() in Figure 3, not geom_text_repel() (but I could be mistaken).

It seems possible that ggbreak does not implement subsetting the data for each panel. I don't have time to study the ggbreak code right now to be certain. I have an inkling that the best solution is for both packages to use a hidden channel for communicating details with each other (similar to ggpp).

In the absence of clear communication between the ggbreak and ggrepel, I came up with a workaround that might work in some cases.

The workaround is a new parameter geom_text_repel(max.distance = 1). If a data label is too far away from its point, then it will be discarded. (This is a similar concept to max.overlaps = 10, where a data label is discarded when it overlaps too many other things.)

Below is an example of how the new parameter is working right now in the new branch max_distance. Notice that I had to create a new dataframe d2 that omits the data points in the break.

My sense is that the max.distance parameter might be useful for many people in many situations, so I might add it to the next version of ggrepel.

library(ggrepel)
#> Loading required package: ggplot2
library(ggbreak)
#> ggbreak v0.1.2
#> 
#> If you use ggbreak in published research, please cite the following
#> paper:
#> 
#> S Xu, M Chen, T Feng, L Zhan, L Zhou, G Yu. Use ggbreak to effectively
#> utilize plotting space to deal with large datasets and outliers.
#> Frontiers in Genetics. 2021, 12:774846. doi: 10.3389/fgene.2021.774846

d2 <- mtcars[mtcars$mpg > 25 | mtcars$mpg < 15,]

p <- ggplot(d2, aes(wt, mpg, label = rownames(d2))) +
  geom_point(color = 'red') +
  theme_classic(base_size = 16) +
  scale_y_break(c(15, 25))

If we disable max.distance this is what we get:

p + geom_text_repel(max.distance = Inf)

If we accept the default max.distance=1 we get a different plot:

p + geom_text_repel()

Notice that this does not work well if we use the full data frame that includes all of the observations:

p <- ggplot(mtcars, aes(wt, mpg, label = rownames(mtcars))) +
  geom_point(color = 'red') +
  theme_classic(base_size = 16) +
  scale_y_break(c(15, 25))

p + geom_text_repel(max.distance = 1)

We can try to work around this by using a smaller value for max.distance, but the result is not ideal:

p + geom_text_repel(max.distance = 0.1)

Created on 2023-12-02 with reprex v2.0.2

Session info ``` r sessioninfo::session_info() #> ─ Session info ─────────────────────────────────────────────────────────────── #> setting value #> version R version 4.2.3 (2023-03-15) #> os macOS Ventura 13.4 #> system aarch64, darwin20 #> ui X11 #> language (EN) #> collate en_US.UTF-8 #> ctype en_US.UTF-8 #> tz America/New_York #> date 2023-12-02 #> pandoc 3.1.1 @ /Applications/RStudio.app/Contents/Resources/app/quarto/bin/tools/ (via rmarkdown) #> #> ─ Packages ─────────────────────────────────────────────────────────────────── #> package * version date (UTC) lib source #> aplot 0.2.2 2023-10-06 [1] CRAN (R 4.2.0) #> cachem 1.0.8 2023-05-01 [1] CRAN (R 4.2.0) #> cli 3.6.1 2023-03-23 [1] CRAN (R 4.2.0) #> colorspace 2.1-0 2023-01-23 [1] CRAN (R 4.2.0) #> curl 5.1.0 2023-10-02 [1] CRAN (R 4.2.0) #> digest 0.6.31 2022-12-11 [1] CRAN (R 4.2.0) #> dplyr 1.1.2 2023-04-20 [1] CRAN (R 4.2.0) #> evaluate 0.21 2023-05-05 [1] CRAN (R 4.2.0) #> fansi 1.0.4 2023-01-22 [1] CRAN (R 4.2.0) #> farver 2.1.1 2022-07-06 [1] CRAN (R 4.2.0) #> fastmap 1.1.1 2023-02-24 [1] CRAN (R 4.2.0) #> fs 1.6.2 2023-04-25 [1] CRAN (R 4.2.0) #> generics 0.1.3 2022-07-05 [1] CRAN (R 4.2.0) #> ggbreak * 0.1.2 2023-06-26 [1] CRAN (R 4.2.0) #> ggfun 0.1.3 2023-09-15 [1] CRAN (R 4.2.0) #> ggplot2 * 3.4.2 2023-04-03 [1] CRAN (R 4.2.0) #> ggplotify 0.1.2 2023-08-09 [1] CRAN (R 4.2.0) #> ggrepel * 0.9.4 2023-12-02 [1] local #> glue 1.6.2 2022-02-24 [1] CRAN (R 4.2.0) #> gridGraphics 0.5-1 2020-12-13 [1] CRAN (R 4.2.0) #> gtable 0.3.3 2023-03-21 [1] CRAN (R 4.2.0) #> highr 0.10 2022-12-22 [1] CRAN (R 4.2.0) #> htmltools 0.5.5 2023-03-23 [1] CRAN (R 4.2.0) #> knitr 1.43 2023-05-25 [1] CRAN (R 4.2.0) #> labeling 0.4.2 2020-10-20 [1] CRAN (R 4.2.0) #> lifecycle 1.0.3 2022-10-07 [1] CRAN (R 4.2.0) #> magrittr 2.0.3 2022-03-30 [1] CRAN (R 4.2.0) #> memoise 2.0.1 2021-11-26 [1] CRAN (R 4.2.0) #> munsell 0.5.0 2018-06-12 [1] CRAN (R 4.2.0) #> patchwork 1.1.2 2022-08-19 [1] CRAN (R 4.2.0) #> pillar 1.9.0 2023-03-22 [1] CRAN (R 4.2.0) #> pkgconfig 2.0.3 2019-09-22 [1] CRAN (R 4.2.0) #> R6 2.5.1 2021-08-19 [1] CRAN (R 4.2.0) #> Rcpp 1.0.10 2023-01-22 [1] CRAN (R 4.2.0) #> reprex 2.0.2 2022-08-17 [1] CRAN (R 4.2.0) #> rlang 1.1.1 2023-04-28 [1] CRAN (R 4.2.0) #> rmarkdown 2.23 2023-07-01 [1] CRAN (R 4.2.0) #> rstudioapi 0.15.0 2023-07-07 [1] CRAN (R 4.2.0) #> scales 1.2.1 2022-08-20 [1] CRAN (R 4.2.0) #> sessioninfo 1.2.2 2021-12-06 [1] CRAN (R 4.2.0) #> tibble 3.2.1 2023-03-20 [1] CRAN (R 4.2.0) #> tidyselect 1.2.0 2022-10-10 [1] CRAN (R 4.2.0) #> utf8 1.2.3 2023-01-31 [1] CRAN (R 4.2.0) #> vctrs 0.6.3 2023-06-14 [1] CRAN (R 4.2.3) #> withr 2.5.0 2022-03-03 [1] CRAN (R 4.2.0) #> xfun 0.39 2023-04-20 [1] CRAN (R 4.2.0) #> xml2 1.3.4 2023-04-27 [1] CRAN (R 4.2.0) #> yaml 2.3.7 2023-01-23 [1] CRAN (R 4.2.0) #> yulab.utils 0.1.0 2023-09-20 [1] CRAN (R 4.2.0) #> #> [1] /Library/Frameworks/R.framework/Versions/4.2-arm64/Resources/library #> #> ────────────────────────────────────────────────────────────────────────────── ```
slowkow commented 9 months ago

Interested readers can try the experimental parameter max.distance by using code from this branch:

https://github.com/slowkow/ggrepel/tree/max_distance

slowkow commented 9 months ago

I think the max.distance parameter is not ideal, so I tried another approach in this branch:

https://github.com/slowkow/ggrepel/tree/data-limits

It works with ggbreak, but the new code does not work for these cases:

So... there is still more to do. I might just add an if() to see if we're using sf or polar to avoid discarding labels in those cases. Hopefully that is easy to do.

slowkow commented 9 months ago

You can see the code that fixes the issue here: https://github.com/slowkow/ggrepel/commit/b190d68d3bbf643e46895402e241da0e3516bc18

@willizhang Could I please ask if you could test the new code and share your results here?

You can install the correct version of the code like this:

devtools::install_github("slowkow/ggrepel", ref="7c68f3f9185fd78253d4a7534f774df37cbcb176")

Here is a complete example:

library(ggrepel)
#> Loading required package: ggplot2
library(ggbreak)
#> ggbreak v0.1.2
#> 
#> If you use ggbreak in published research, please cite the following
#> paper:
#> 
#> S Xu, M Chen, T Feng, L Zhan, L Zhou, G Yu. Use ggbreak to effectively
#> utilize plotting space to deal with large datasets and outliers.
#> Frontiers in Genetics. 2021, 12:774846. doi: 10.3389/fgene.2021.774846
p <- ggplot(mtcars, aes(wt, mpg, label = rownames(mtcars))) +
  geom_point(color = 'red') +
  theme_classic(base_size = 16) +
  scale_y_break(c(15, 25))
p + geom_text_repel()

p + geom_label_repel()

Created on 2023-12-04 with reprex v2.0.2

Session info ``` r sessioninfo::session_info() #> ─ Session info ─────────────────────────────────────────────────────────────── #> setting value #> version R version 4.2.3 (2023-03-15) #> os macOS Ventura 13.4 #> system aarch64, darwin20 #> ui X11 #> language (EN) #> collate en_US.UTF-8 #> ctype en_US.UTF-8 #> tz America/New_York #> date 2023-12-04 #> pandoc 3.1.1 @ /Applications/RStudio.app/Contents/Resources/app/quarto/bin/tools/ (via rmarkdown) #> #> ─ Packages ─────────────────────────────────────────────────────────────────── #> package * version date (UTC) lib source #> aplot 0.2.2 2023-10-06 [1] CRAN (R 4.2.0) #> cachem 1.0.8 2023-05-01 [1] CRAN (R 4.2.0) #> cli 3.6.1 2023-03-23 [1] CRAN (R 4.2.0) #> colorspace 2.1-0 2023-01-23 [1] CRAN (R 4.2.0) #> curl 5.1.0 2023-10-02 [1] CRAN (R 4.2.0) #> digest 0.6.31 2022-12-11 [1] CRAN (R 4.2.0) #> dplyr 1.1.2 2023-04-20 [1] CRAN (R 4.2.0) #> evaluate 0.21 2023-05-05 [1] CRAN (R 4.2.0) #> fansi 1.0.5 2023-10-08 [1] CRAN (R 4.2.0) #> farver 2.1.1 2022-07-06 [1] CRAN (R 4.2.0) #> fastmap 1.1.1 2023-02-24 [1] CRAN (R 4.2.0) #> fs 1.6.2 2023-04-25 [1] CRAN (R 4.2.0) #> generics 0.1.3 2022-07-05 [1] CRAN (R 4.2.0) #> ggbreak * 0.1.2 2023-06-26 [1] CRAN (R 4.2.0) #> ggfun 0.1.3 2023-09-15 [1] CRAN (R 4.2.0) #> ggplot2 * 3.4.4 2023-10-12 [1] CRAN (R 4.2.0) #> ggplotify 0.1.2 2023-08-09 [1] CRAN (R 4.2.0) #> ggrepel * 0.9.4.9999 2023-12-04 [1] local #> glue 1.6.2 2022-02-24 [1] CRAN (R 4.2.0) #> gridGraphics 0.5-1 2020-12-13 [1] CRAN (R 4.2.0) #> gtable 0.3.4 2023-08-21 [1] CRAN (R 4.2.0) #> highr 0.10 2022-12-22 [1] CRAN (R 4.2.0) #> htmltools 0.5.5 2023-03-23 [1] CRAN (R 4.2.0) #> knitr 1.43 2023-05-25 [1] CRAN (R 4.2.0) #> labeling 0.4.3 2023-08-29 [1] CRAN (R 4.2.0) #> lifecycle 1.0.4 2023-11-07 [1] CRAN (R 4.2.3) #> magrittr 2.0.3 2022-03-30 [1] CRAN (R 4.2.0) #> memoise 2.0.1 2021-11-26 [1] CRAN (R 4.2.0) #> munsell 0.5.0 2018-06-12 [1] CRAN (R 4.2.0) #> patchwork 1.1.2 2022-08-19 [1] CRAN (R 4.2.0) #> pillar 1.9.0 2023-03-22 [1] CRAN (R 4.2.0) #> pkgconfig 2.0.3 2019-09-22 [1] CRAN (R 4.2.0) #> R6 2.5.1 2021-08-19 [1] CRAN (R 4.2.0) #> Rcpp 1.0.11 2023-07-06 [1] CRAN (R 4.2.0) #> reprex 2.0.2 2022-08-17 [1] CRAN (R 4.2.0) #> rlang 1.1.2 2023-11-04 [1] CRAN (R 4.2.0) #> rmarkdown 2.23 2023-07-01 [1] CRAN (R 4.2.0) #> rstudioapi 0.15.0 2023-07-07 [1] CRAN (R 4.2.0) #> scales 1.3.0 2023-11-28 [1] CRAN (R 4.2.3) #> sessioninfo 1.2.2 2021-12-06 [1] CRAN (R 4.2.0) #> tibble 3.2.1 2023-03-20 [1] CRAN (R 4.2.0) #> tidyselect 1.2.0 2022-10-10 [1] CRAN (R 4.2.0) #> utf8 1.2.4 2023-10-22 [1] CRAN (R 4.2.0) #> vctrs 0.6.5 2023-12-01 [1] CRAN (R 4.2.3) #> withr 2.5.2 2023-10-30 [1] CRAN (R 4.2.0) #> xfun 0.39 2023-04-20 [1] CRAN (R 4.2.0) #> xml2 1.3.4 2023-04-27 [1] CRAN (R 4.2.0) #> yaml 2.3.7 2023-01-23 [1] CRAN (R 4.2.0) #> yulab.utils 0.1.0 2023-09-20 [1] CRAN (R 4.2.0) #> #> [1] /Library/Frameworks/R.framework/Versions/4.2-arm64/Resources/library #> #> ────────────────────────────────────────────────────────────────────────────── ```
willizhang commented 9 months ago

Hi Kamil,

Thank you very much for your help. I have tried the codes with alluvial plot and it works well in this example:

library(ggalluvial)
library(ggplot2)
library(ggrepel)
library(ggbreak)

titanic_wide <- data.frame(Titanic)
titanic_long <- to_lodes_form(titanic_wide, axes = 1:4,
                              key = "variable", value = "value", id = "cohort",
                              diffuse = Class)

ggplot(
  data = titanic_long,
  aes(x = variable, stratum = value, alluvium = cohort, y = Freq)
) +
  geom_alluvium(aes(fill=Class)) +
  geom_stratum(aes(fill=Class)) +
  scale_y_break( c( 50, 500 ), scales = 10, space = 0.3 ) +
  geom_text(stat = "stratum", aes(label = after_stat(stratum)) ) +
  theme_classic() +
  ggtitle(
    "passengers on the maiden voyage of the Titanic",
    "stratified by demographics and survival"
  )+
  scale_fill_manual(
    values=c("red","orange","green","blue"),
    breaks=c("1st","2nd","3rd","Crew"),
    labels=c("1st","2nd","3rd","Crew"),
    na.value = NA,
    aesthetics = c("fill", "color")
  ) +
  geom_text_repel(stat = "alluvium",
                  aes(x = as.integer(variable) + 0.15,
                      color = Class,
                      label = ifelse(variable == "Survived" & Freq >= 10, Freq, NA)),
                  direction = "y", nudge_x = .5,
                  point.padding = 0,
                  hjust = "left")
image

However, when I am applying the codes to my original data, an error message occurred:

Error in `geom_text_repel()`:
! Problem while converting geom to grob.
ℹ Error occurred in the 4th layer.
Caused by error in `which()`:
! argument to 'which' is not logical
Run `rlang::last_trace()` to see where the error occurred.
slowkow commented 9 months ago

Thanks for sharing!

Regarding your new error message, I would advise you to share a reprex so others can test it. If you think this is a different issue than the original one, it'd be nice to open a new issue for it.

If you could share the output of rlang::last_trace(), at the very least, then we might have a chance to understand the problem.

slowkow commented 4 months ago

@willizhang Hi, I'm just writing to let you know I had to drop support for ggbreak. The change that supports ggbreak also broke a lot of people's code. If anyone wants to try to find a way to support ggbreak without breaking other code, feel free to open a PR. This is the relevant commit where we dropped support for ggbreak: 4119c28957e956ad39d65254a4ce76377ed0e5ae