Closed snarfed closed 8 years ago
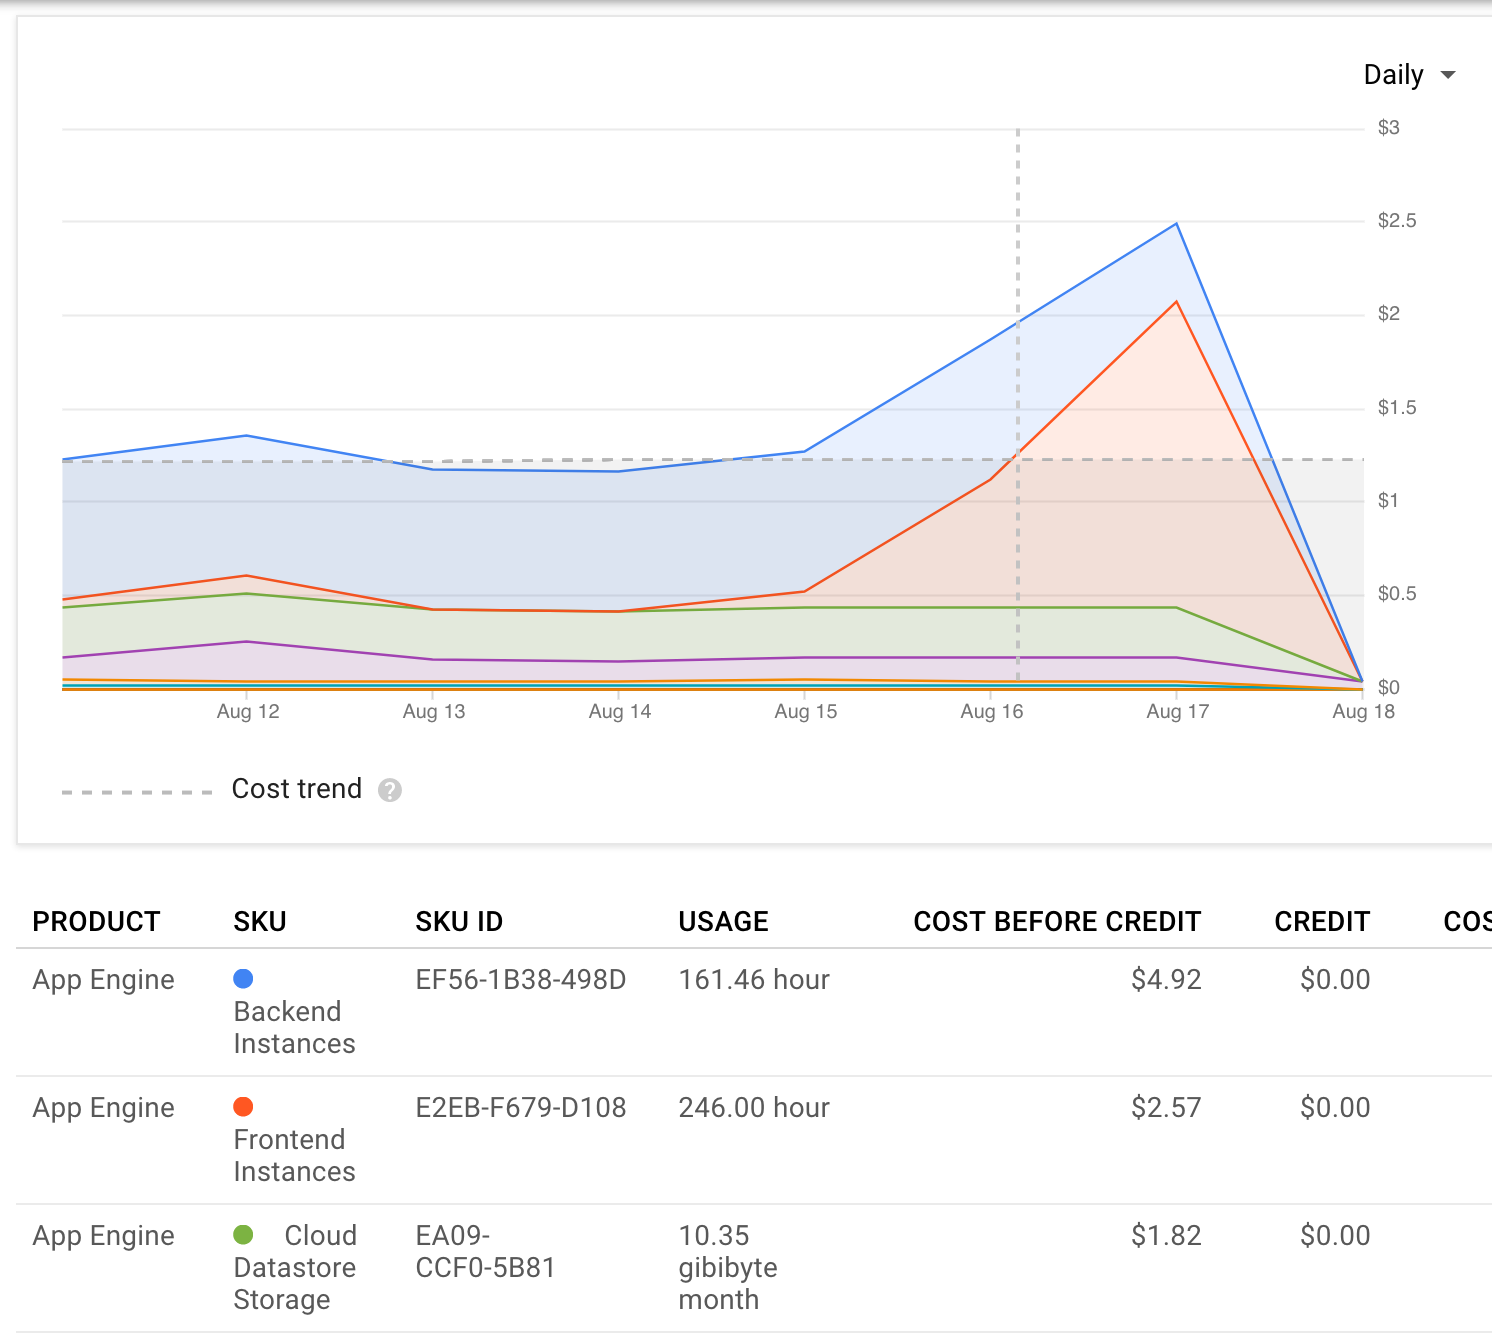
the really annoying part is that we don't actually need more than one instance, but app engine's scheduler doesn't handle us well and thinks we do, so it usually keeps two or three around. from https://console.developers.google.com/appengine/instances?project=brid-gy&moduleId=default&versionId=7&duration=P1D :
this is the norm. one instance serves almost all of the requests; the remaining instance(s) serve almost none.
details on how app engine's request scheduler/auto scaler works in the links below. i've tried lots of different values (including default) for Max Idle Instances and Min Pending Latency, different instance classes, and other settings, but haven't managed to change this behavior. :/
basic and manual scaling are tempting, but only get 8 free instance hours per day, as opposed to automatic scaling's 28, so they're right out.
@kylewm and i talked a bit on IRC just now on profiling. our request volume is mostly poll and propagate (~87% and ~9% each, respectively), both of which i expect spend most of their time blocked on network I/O. good idea to check, though. app stats is great for that; we can turn it on here.
the poll task queue is currently configured to run up to 2 at a time, propagate up to 1 at a time, and we have threadsafe: yes
in our app.yaml to allow instances to serve multiple requests concurrently. last time i checked with bridgy's instance info recording, this was indeed happening.
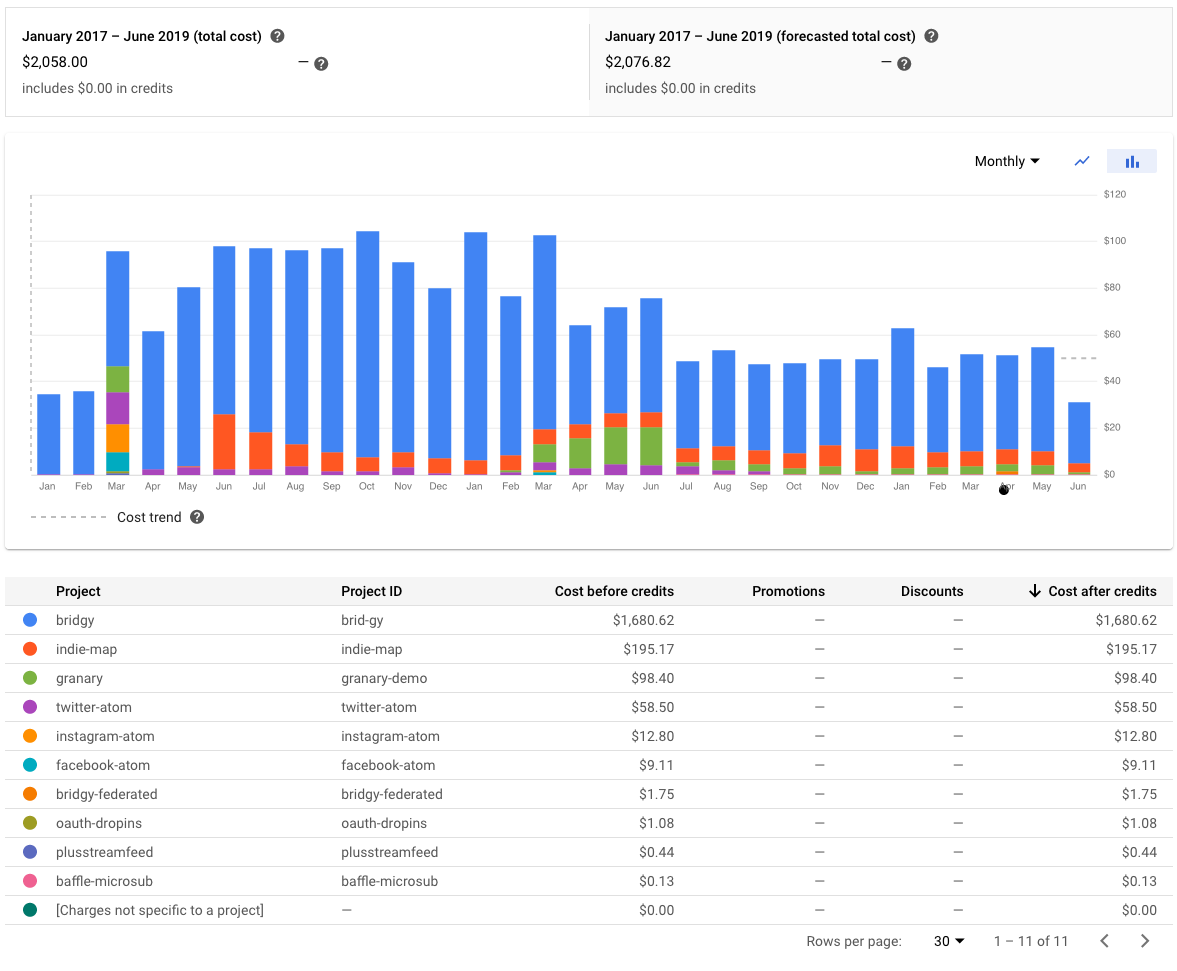
for reference, here's bridgy's lifetime cost history. it breaks down to roughly 2/3 frontend instances, 1/3 datastore ops (reads/writes).
tried another experiment: removed max_concurrent_requests: 4
from the poll queue and let it run as many as once as it wanted. part of the motivation was to let backlogs clear faster and avoid telling users "next poll in 1m" for long periods of time, but also a (weak) hypothesis was that running more polls simultaneously would better utilize instances.
in practice, it didn't clearly help or hurt. i flipped the switch feb 10 ~11am. the main difference i see is that our active instance count was more jagged and variable because we weren't throttling polls (and thus load).
i also don't know why feb 9 evening averaged so low, but afaik it wasn't due to anything we did.
oh, right, polls were unusually slow feb 9 evening, i suspect due to one of the silo APIs having issues and being slow itself. not sure why that would drop our average instance count, but it is the one clear correlation.
i started experimenting with this again yesterday. coincidentally, poll latency also spiked a bit before i started experimenting, and has stayed pretty high.
the only change i made that could have caused that was deploying #620 and snarfed/granary@74aed5c7025d75e93dd59b959537023f50cae6be, both of which really seem unrelated. maybe i accidentally deployed a different version of some libraries in my virtualenv? (although deploy.sh should have caught that?) maybe some bad new interaction in app engine 1.9.33? i don't know. :(
anecdotally, it seems like the cause might be slower HTTP fetches during OPD. i looked at a few poll logs and saw a number of >10s requests when fetching different people's web pages. :(
here are the experiment results, even if they're tainted by the high latency.
the magic single-instance period starting at 10am was the first time with min_idle_instances=0, max_idle_instances=1
, but the poll queue was caught up when that started, which i suspect mattered. otherwise, unclear.
latency is slowly maybe getting back to normal.
well that's a pleasant surprise.
definitely promising. looks like we may be able to hold sustain ~1.5 instances on average. we'll see.
seeing substantial poll latency spikes again. anecdotally, it looks like many of the long requests are doing OPD refetch. filed #624 to optimize.
huh, there's weird big gaps between RPCs. Not sure if that's the process being asleep, or if it's actually doing something processor intensive in that time.
here's another one
whoa, those are big gaps indeed.15-25s?! i mean, I'm sure some of our compute is inefficient, but not that inefficient.
i guess we could try to repro it in dev_appserver, refetching a local web server, and comment out parts of the code in the gap and binary search down until we isolate it. maybe tedious, but could work.
maybe it's context switching to other requests in other threads? hard to believe though. i'd think it should be doing that during the API calls, and i'd also hope no self respecting scheduler would starve a thread for 20s at a time.
maybe worth searching/asking on SO or https://groups.google.com/forum/m/#!forum/google-appengine ?
I found one where the spacing is much more regular
After adding some more debug output, I'm finding that mf2 parsing regularly takes longer than the fetch itself
D 2016-02-26 16:24:34.896 fetching post permalink https://cmal.info/2016/online-legal-publishers-squabble-over-the-right-to-copyright-the
D 2016-02-26 16:24:35.248 done fetching. now parsing post for mf2 https://cmal.info/2016/online-legal-publishers-squabble-over-the-right-to-copyright-the
D 2016-02-26 16:24:36.749 done parsing https://cmal.info/2016/online-legal-publishers-squabble-over-the-right-to-copyright-the
That's 350ms for fetching, 1500ms for parsing!
hoooooly crap, really?!? that's...not OK.
also profiling++ obviously. thanks for doing this!
i wonder if switching HTML parsers would help? i guess it's time to cpu profile mf2py.
Just doing some basic dumb testing now locally. Lxml doesn't seem significantly faster :(
On February 26, 2016 8:56:26 AM PST, Ryan Barrett notifications@github.com wrote:
hoooooly crap, really?!? that's...not OK.
also profiling++ obviously. thanks for doing this!
i wonder if switching HTML parsers would help? i guess it's time to cpu profile mf2py.
Reply to this email directly or view it on GitHub: https://github.com/snarfed/bridgy/issues/578#issuecomment-189369978
Sent from my Android device with K-9 Mail. Please excuse my brevity.
Huh, actually html5lib uses lxml if lxml is installed. And it's a hell of a lot faster with it installed (but still slow). Parsing my homepage and all permalinks from there:
total time in requests.get: 0.322495
total time in BeautifulSoup ctor: 0.999292
total time in mf2py.parse: 2.284201
I'm at a loss for speeding up mf2. And making the fetches asynchronous is moot when so much more time is spent processing the result. I'll continue this on #624
whoa, they added a "Billed instances estimate" (green) to the instances graph, and it's noticeably below the total instance count (blue), which is what i thought they were charging for. nice!
...hmm. oddly the billed instances estimate is sometimes higher than the total instance count. confusing. 🤔
we get Twitter favorites by fetching and scraping html for each tweet, in serial. i thought parallelizing these with async utlfetch could be a big win, but i looked at ~10 Twitter polls anecdotally, and most didn't fetch any favorites HTML pages, and the rest only fetched one. looks like our caching logic is working. yay. measure first then optimize, and all that!
we've been back on min_idle_instances: 0, max_idle_instances: 1
for a few days now, and it definitely does cut down instance count, but anecdotally it also hurts interactive latency pretty badly. :/ (cc @tantek @aaronpk.)
as an experiment, i dropped max_idle_instances: 1
and kept min_idle_instances: 0
to see if that helps latency while still keeping some of the instance count improvement. we'll see.
ok so https://cloud.google.com/trace/docs/analysis-reports is pretty great. aggregated latency reports for any subset of URL, HTTP method, etc.
here are some comparing default auto scaling to min_indle_instances: 0
. default is better latency, as suspected, but it doesn't look like a huge difference. maybe i'm reading the graphs wrong? not sure.
/
(home page):
/twitter/*
(user pages):
/like/*
(mf2 handlers):
poll and propagate are also interesting but less meaningful. we only really care about fine grained latency for interactive pages and mf2 handlers.
poll:
propagate:
interesting data point: anecdotally, when i've glanced at the poll queue over the last week or so, it's often idle or only running one poll. i think it used to consistently be running 4-8 at any given time. so, that implies #624 is largely done.
...however, with the default auto-scaling options, we still hang out at two instances most of the time. so, either app engine's auto scaling just still doesn't handle our workload well (very possible), or there's a lot of load we're missing.
here's some back of the envelope math: we avg .3qps right now, ie ~26k requests per day. over the last 24h, we've had ~16k polls, ~2k propagates, and a handful of front page, retry, publish, propagate-blogpost, etc...but nowhere near the remaining 8k. i'm going to look at logs now to see what those were. they might be bots, in which case i can add user pages to robots.txt...
look at the last week, the remaining 8k qpd include:
searching for all bots (ie \*[Bb]ot\*
) shows ~930 qpd, which is totally reasonable (if very inexact).
hmm, I know airbornesurfer IRL, sort of doubt he knows that's happening (he should just be on the vanilla wordpress plugin).
1200 WordPress (every fetch is repeated 3x :( )
micro-caching might help?
yeah i guess that'd be #15. (that issue number tho! :P)
also i pinged airbornesurfer: https://twitter.com/schnarfed/status/709519485795840001
more importantly, 1200 qpd is <1qpm, and those requests average 1-2s, so i don't think that's really our problem. same with all the other requests in that breakdown.
i think app engine's auto scaling just really doesn't like our workload. if we can convince ourselves that min_idle_instances: 0
doesn't really hurt latency too much - which i'm not at all sure of - i vote to leave that on and call it a day.
go home billed instance estimate ur drunk
so after tons of work and soul searching and waffling, i think all the optimization here was nice and appreciated, but really the one thing that did the trick all by itself (and didn't drive our latency through the roof) was max_idle_instances: 1
. whee. :P
tentatively closing for now.
incidentally, wow, billed instance estimate really does just get totally drunk sometimes. no clue why. funny.
weird new instance scaling pattern recently. we had a good month or two where our instance count mostly hung out around 1, but now it's jumping up to 2 for periods of ~12h (and right now >24h). i haven't found that it corresponds to anything yet (request volume, cron jobs, backups, etc).
for reference, we got billed for 38 instance hrs on 5/6, 39 on 5/5, and 40 on 5/4, ie much closer to the blue line than the yellow Billed instance estimate. boo.
the weird pattern continues. silly. at least they're billing us for close to the estimate (yellow) instead of the total (blue).
weird pattern is gone, more or less.
the granary/o-d python 3 migration bumped up our instance count for some reason, not sure why except that maybe python-future adds meaningfully more overhead?
this moves task queue and cron processing into a separate 'background' service. this decouples quick, light user-facing requests (front page, user pages, etc) from heavier background tasks (poll, propagate, etc), which app engine's scheduler understands and handles better. it now runs the frontend 'default' service on ~1.5 instances avg, and lets me control the 'background' service's instances more directly with manual or basic scaling.
(i'd include instance count graphs, but they're buggy right now and the console isn't showing them. :/ )
background: https://cloud.google.com/appengine/docs/standard/python/an-overview-of-app-engine https://cloud.google.com/appengine/docs/standard/python/modules/converting https://cloud.google.com/appengine/docs/standard/python/config/appref#basic_scaling https://cloud.google.com/appengine/docs/standard/python/config/appref#manual_scaling
now that facebook is dead (#826 #817), i tried an experiment to see if a single frontend instance could serve both interactive requests and poll/propagate tasks. i disabled the dedicated background
service and moved task queues back to targeting the frontend (default
) service.
turns out...no. even if a single frontend instance may theoretically be enough to handle the load, app engine's scheduler still just doesn't like serving two very differently shaped workloads from the same service. it served on 3-4 instances on average, and billed us for 2-3.
i flipped the switch 8/16 1pm PST. background service requests:
frontend service:
frontend instances:
cost:
billable frontend instance hours: 60.73 8/17 (full day), 24.00 8/16 (half day).
ah well. it was worth a shot. turning on the dedicated background service now.
zooming out...costs of running bridgy, granary, indie map, etc over the last two and a half years:
we average ~2 app engine frontend instances right now, and they cost money (at least above the first), so i've been experimenting with different tuning knobs to see if i can get that average down a bit. this isn't high priority, and i'm also not sure i can have much impact without making drastic changes, so this is mostly just for tracking.
directly related:
90 figure out why requests aren't running concurrently (enough)
110 optimize poll task
loosely related:
8 find an alternative to the resident backend for twitter streaming
53 get backend memory usage below cap
145 cache in instance memory as well as memcache
300 try dedicated memcache
here are a few things i've tried recently, and the results. tl;dr: none of them had a meaningful effect on instance count.