 snystrom
commented
1 year ago
snystrom
commented
1 year ago First, I'm so excited you have software called didactic-potato installed on your computer.
Second, I think there's a few ways to do this, but here is one (going to make some assumptions about your inputs here).
If you have a set of regions:
chr1  100  200  geneA . +
chr2  300  400  geneB . -
And you have these as a GRanges:
seqnames     ranges         strand      id
chr1          101-200        +         geneA
chr2          301-400        -         geneB
Then you get the didactic-potato output from your signal (I'm doing this from memory so humor me if this is wrong):
id      position   mean
chr1     101      100
...
chr1      200      10
chr2      301     0
...
chr2      400      20
A naive solutions is to encode strand as 1 or -1 then multiply the signal value based on a lookup table of gene ID and strand multiplier.
i.e. signal from genes on the - strand gets multiplied by -1.
# Assuming you have `dplyr` in your env
strands <- your_genes_granges %>%
   data.frame %>%
   # We code it this way so the fallback is always 1 in the case that strand is "."
   mutate(strand_multiplier = ifelse(strand == "-", -1, 1)) %>%
   select(id, strand_multiplier)
# Content of strands:
id strand_multiplier
geneA 1
geneB -1signal_df %>%
dplyr::left_join(strands, by = "id) %>%
mutate(stranded_mean_signal = mean * strand_multiplier)This will probably give you what you want.
This will be pretty slow for lots of regions (or for large windows with small binsizes) though and will not be very memory efficient (the left_join propagates a lot of unnecessary info & will eat your RAM).
The solution can be simplified as follows. Since the values are already in the positive domain, you only have to keep track of genes that need to have their signal made negative.
minus_strand_gene_ids <- your_genes_granges %>%
   data.frame %>%
   filter(strand == "-") %>%
   pull(id)
Then you can apply the transformation using a lookup table. This will still clone all the values for your + strand genes, so isn't the most memory efficient, but it's probably enough.
signal_df %>%
   dplyr::mutate(stranded_mean_signal = ifelse(id %in% minus_strand_gene_ids, mean * -1, mean))
If you find yourself wanting to optimize the performance more, you'll want to split your regions before running get_average_signal based on strand, then multiply the negative stranded gene values by -1, then bind_rows() the two data.frames. At least I think this will be more efficient.
A future proof solution is to add a stranded argument (or something, default FALSE) to get_average_signal() that does this operation in place based on the ranges metadata.
 14stutzmanav
I'm trying to plot signal at genes so I grabbed some UCSC annotations and made a regions file where each row is a different gene start coordinate plus/minus 10.5kb. I edited the output of get_average_signal() to make the x-axis match the way I set up the regions file, where 0 is the start of the gene. Here's what the plot looks like: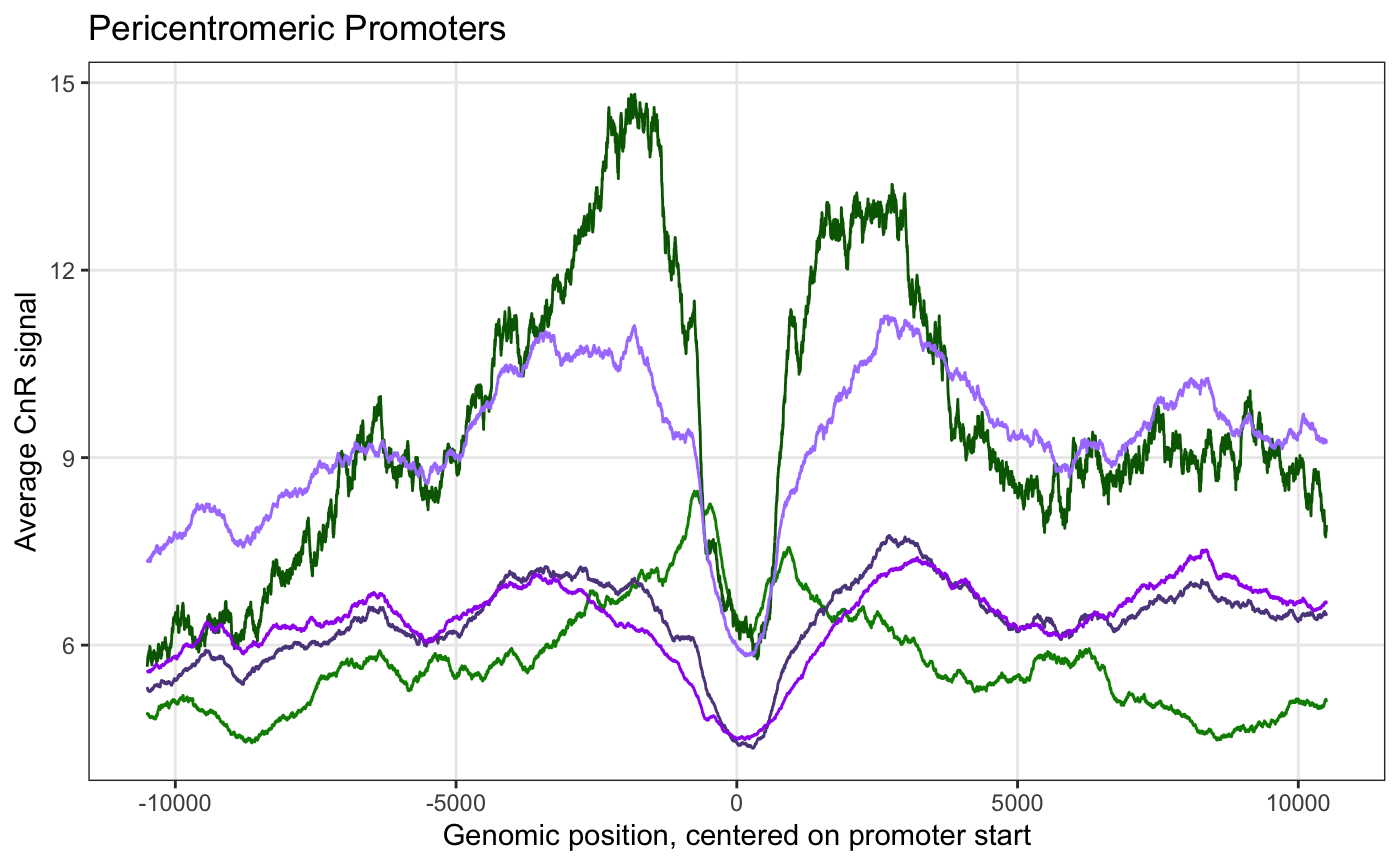
I would now like to consider gene strand in the output of get_average_signal() and I'm having trouble figuring out how to do it. Do you have any suggestions?