 kubu4
commented
2 years ago
kubu4
commented
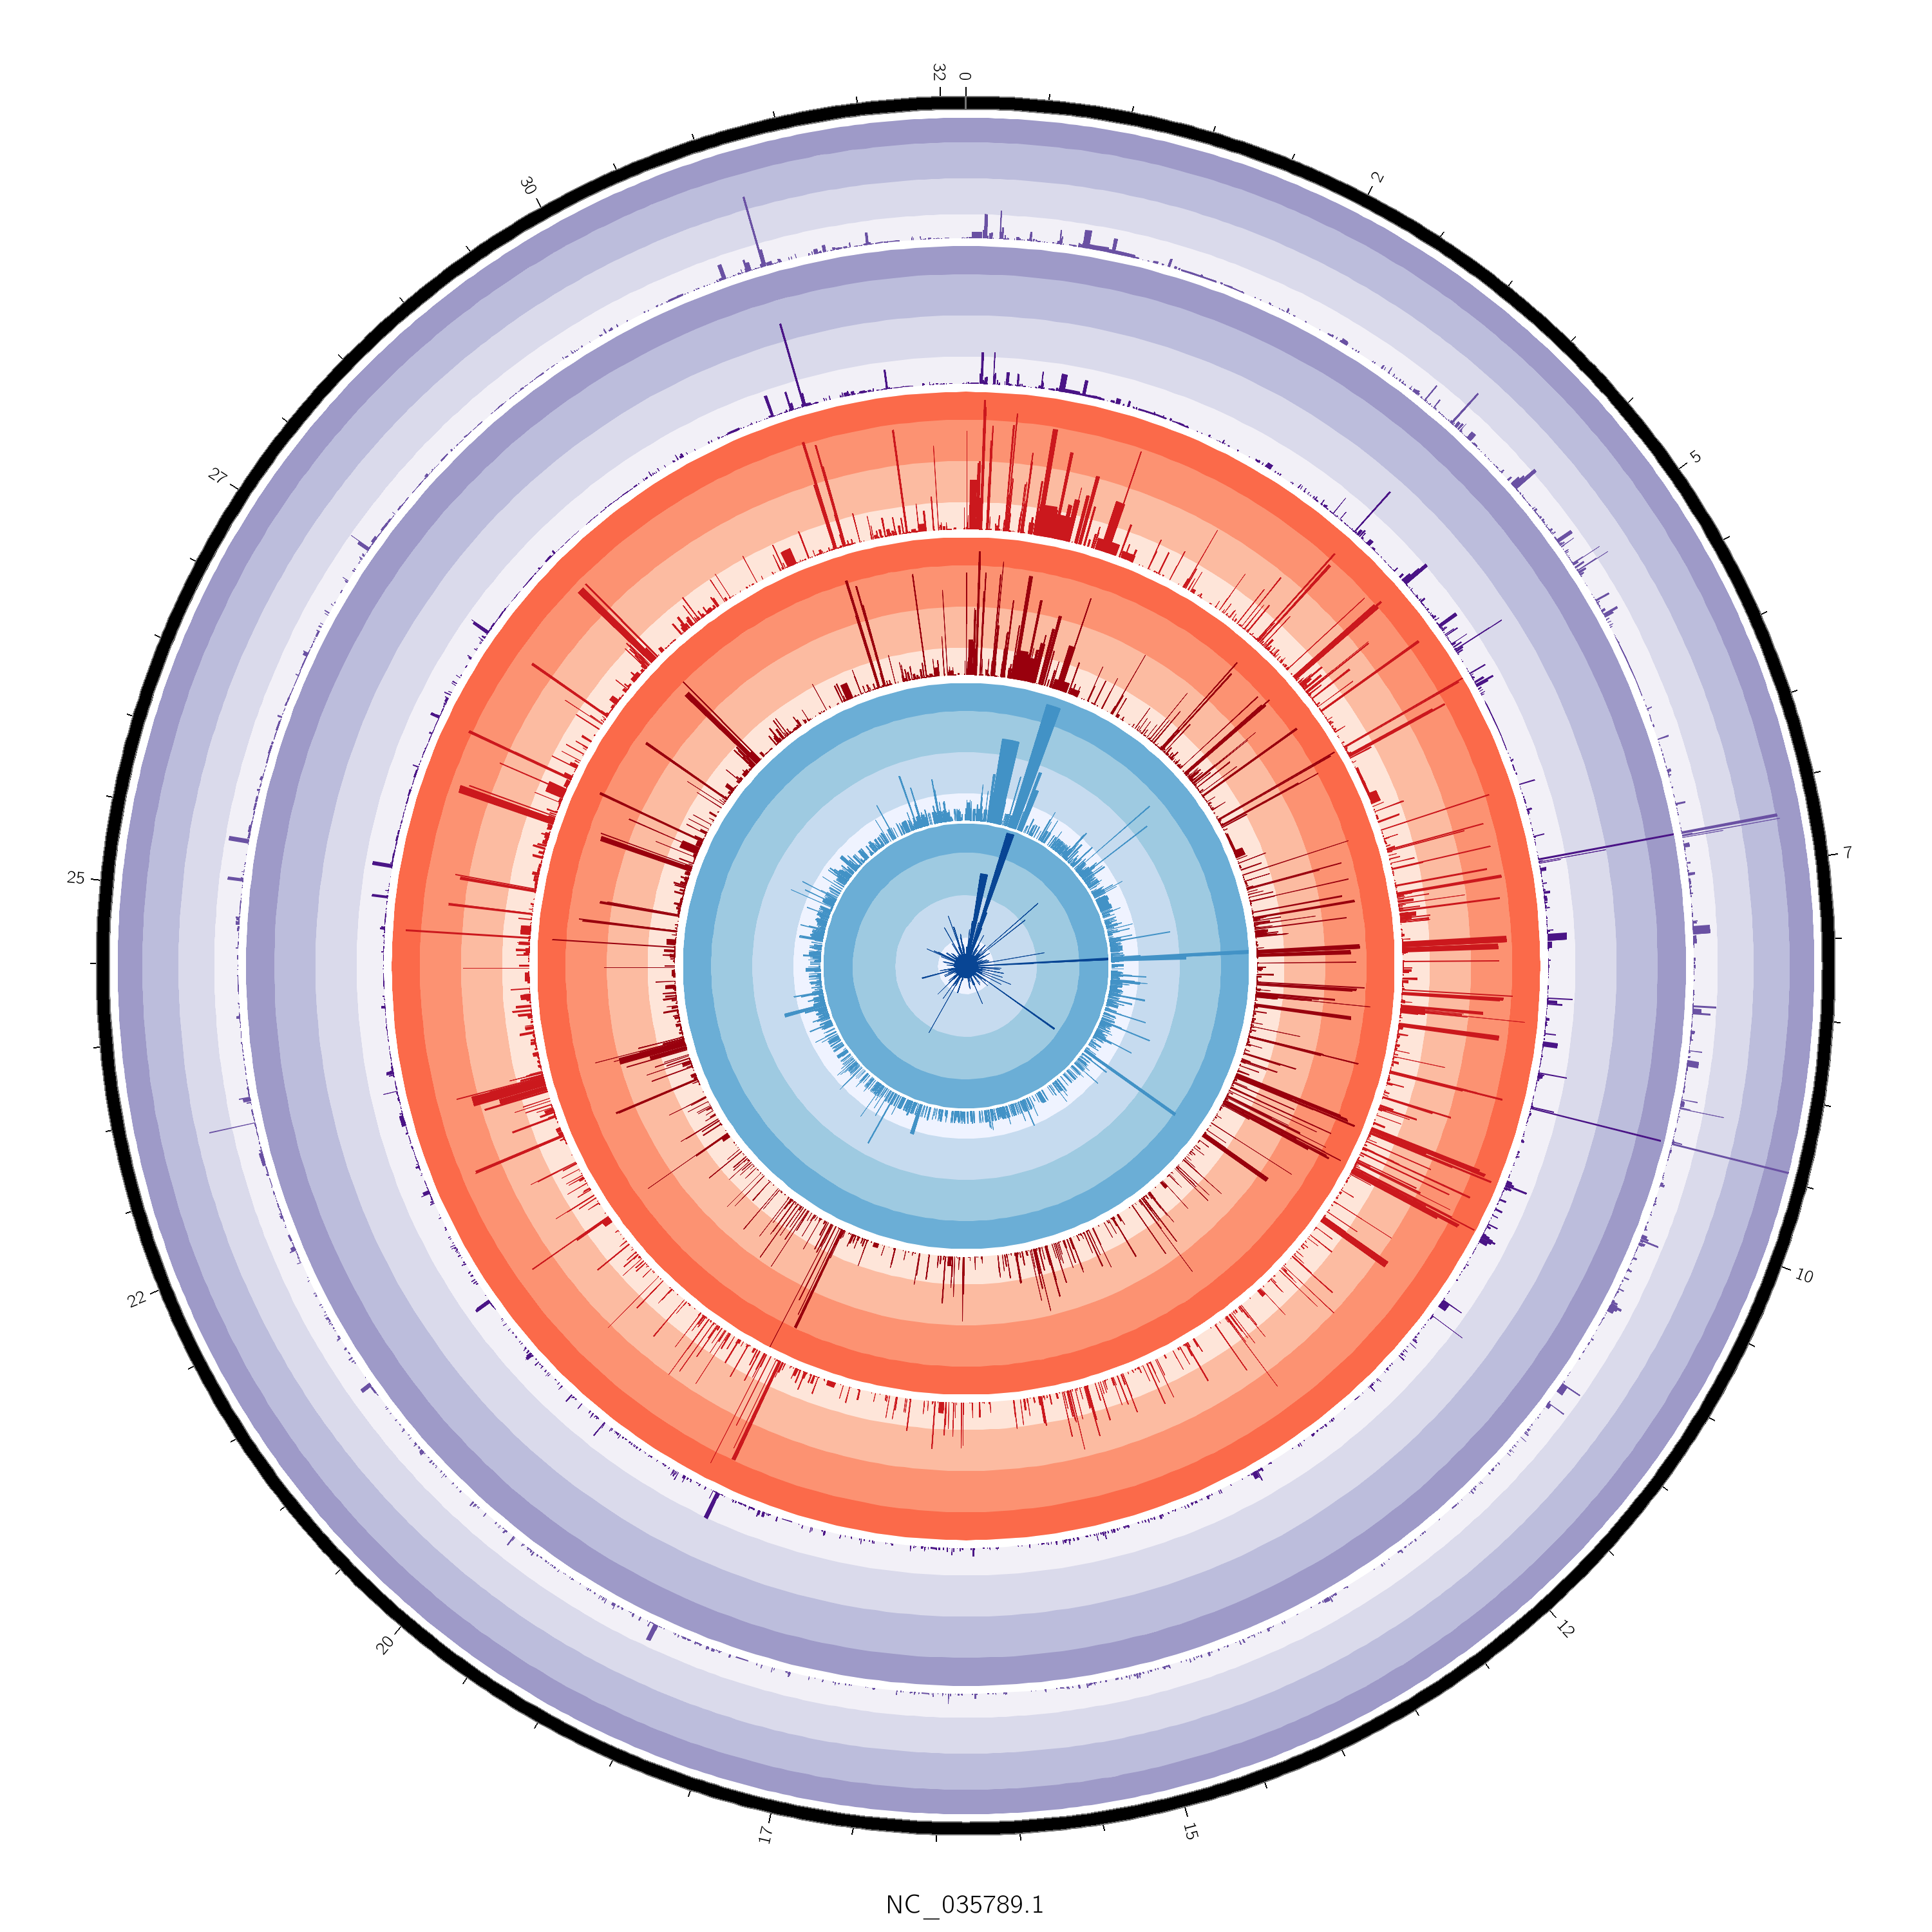
2 years ago Just a status update.
Finally getting back into the swing of things with this stuff. Here's a quick and "easy" plot of a single chromosome showing mean gene FPKM between control females (black inner ring) and exposed females (green inner ring).
Will get some methylation stuff going, as well as transcript counts or something. It's very easy to plot all of this across all chromosomes, but for testing/starting out working on just a single chromosome helps make the process a tad easier.


of gene expression, methylation, etc - maybe 1 chromosome...