 yaaminiv
commented
7 years ago
yaaminiv
commented
7 years ago 
(s/o to @nclowell for pointing out my graph looks like a manta ray 😆)
Closed sr320 closed 7 years ago
yaaminiv
commented
7 years ago
(s/o to @nclowell for pointing out my graph looks like a manta ray 😆)
 laurahspencer
commented
7 years ago
laurahspencer
commented
7 years ago 
 nclowell
commented
7 years ago
nclowell
commented
7 years ago Unfortunately, I need to get through my whole pipeline on my data before I can come up with a meaningful visual. One of the programs takes forever and I tried to run it overnight, but the kernel paused in Jupyter Notebook shakes fist. So I've got very little to show visual-wise for my progress.
If I can get through my pipeline at least on a substantial subset of my data, I'll stick a more meaningful figure here later today. In the meantime, please enjoy this word cloud I made using my custom script for the second major program in the Stacks pipeline, ustacks.

 mfisher5
commented
7 years ago
mfisher5
commented
7 years ago 
 aspanjer
commented
7 years ago
aspanjer
commented
7 years ago  jldimond
commented
7 years ago
jldimond
commented
7 years ago These are residuals from a linear model of ddRAD read counts vs. EpiRAD read counts. Each figure is a sample, and methylated loci are the ones on the bottom of each figure. This is the best way I have figure out so far to represent the EpiRAD data that controls for variations in library size and read depth across samples. If I wanted to be even more conservative, I could convert these data to binary or ordinal (e.g. methylated = 1, nonmethylated = 0).

 mmiddleton
commented
7 years ago
mmiddleton
commented
7 years ago I don't really have an image since I've had so many problems trying to get a Bismark analysis running, so here is an image of what I started today that I very much hope will not crash my computer over the weekend:

 Ellior2
commented
7 years ago
Ellior2
commented
7 years ago Here is a simple Venn Diagram illustrating the number of differentially expressed proteins in oysters reared at 23C and 29C at Day 5 post-settlement. My plan next is to look at protein expression levels between these treatments by looking at peak areas.

 MeganEDuffy
commented
7 years ago
MeganEDuffy
commented
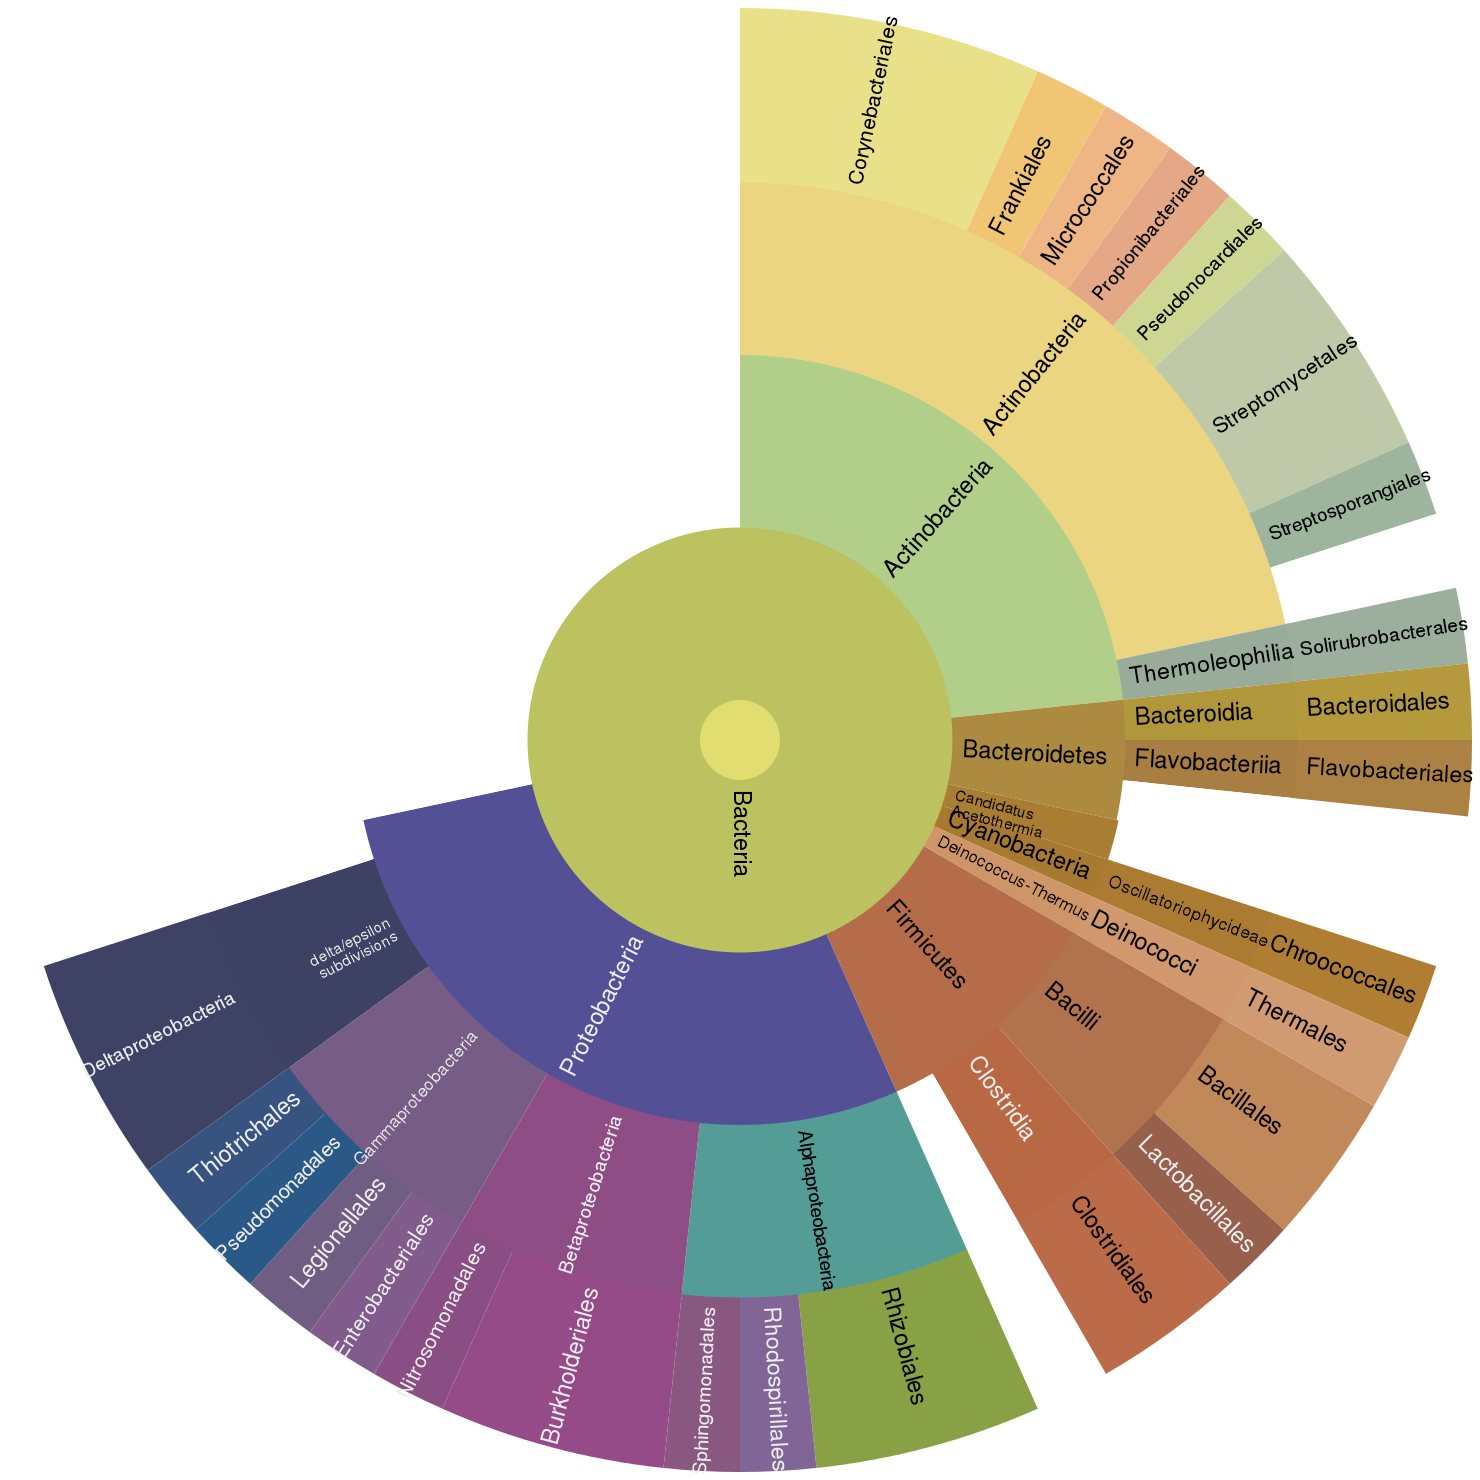
7 years ago Ok, I know I wasn supposed to generate another kind of figure than this Lowest Common Ancestor analysis of de novo sequences peptides - but this is a different sample! (And, my attempts at getting a list to proteins to use in GO analysis haven't worked yet).
For this week I would like everyone to post a single image that best represents the analyses you have done for your class project, to date.
In addition, please ship another release before the end of the week.
Your response below will need to formatted such that when I click on your image, I get directed to your release page.