sr320
commented
7 years ago
sr320
commented
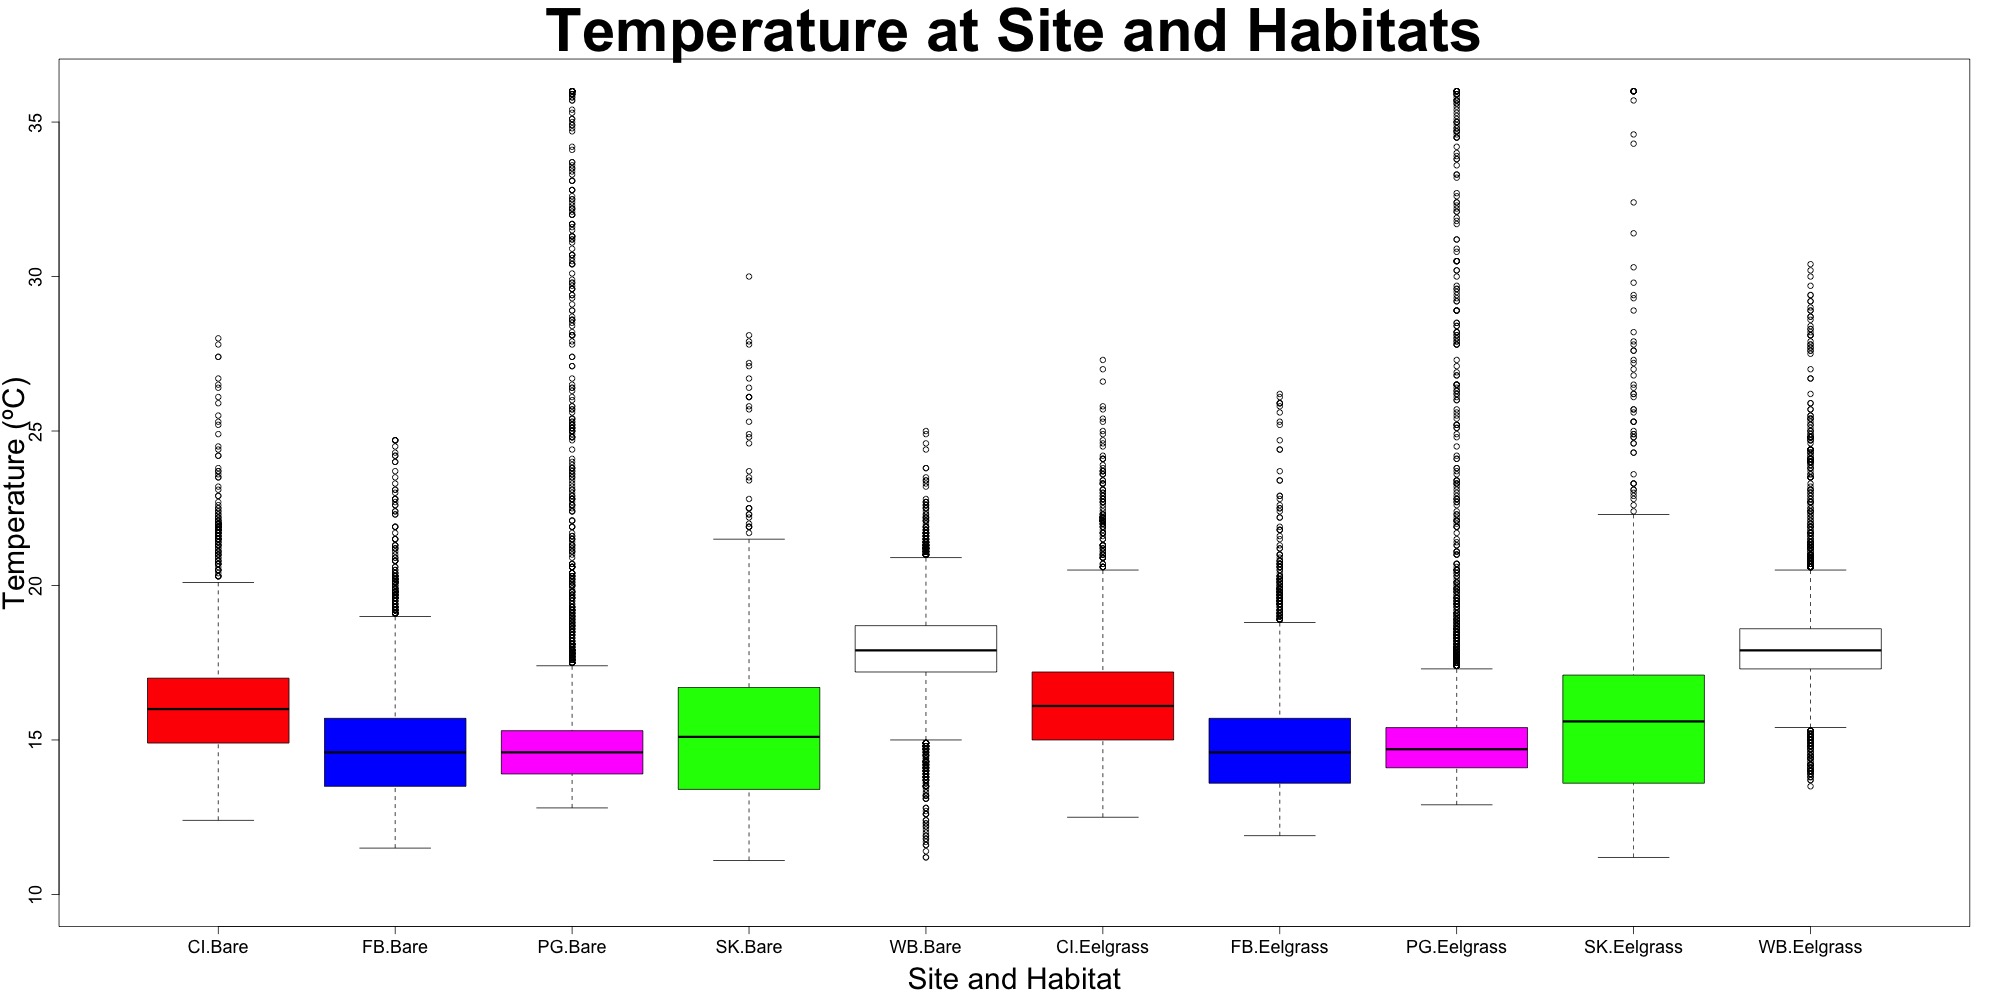
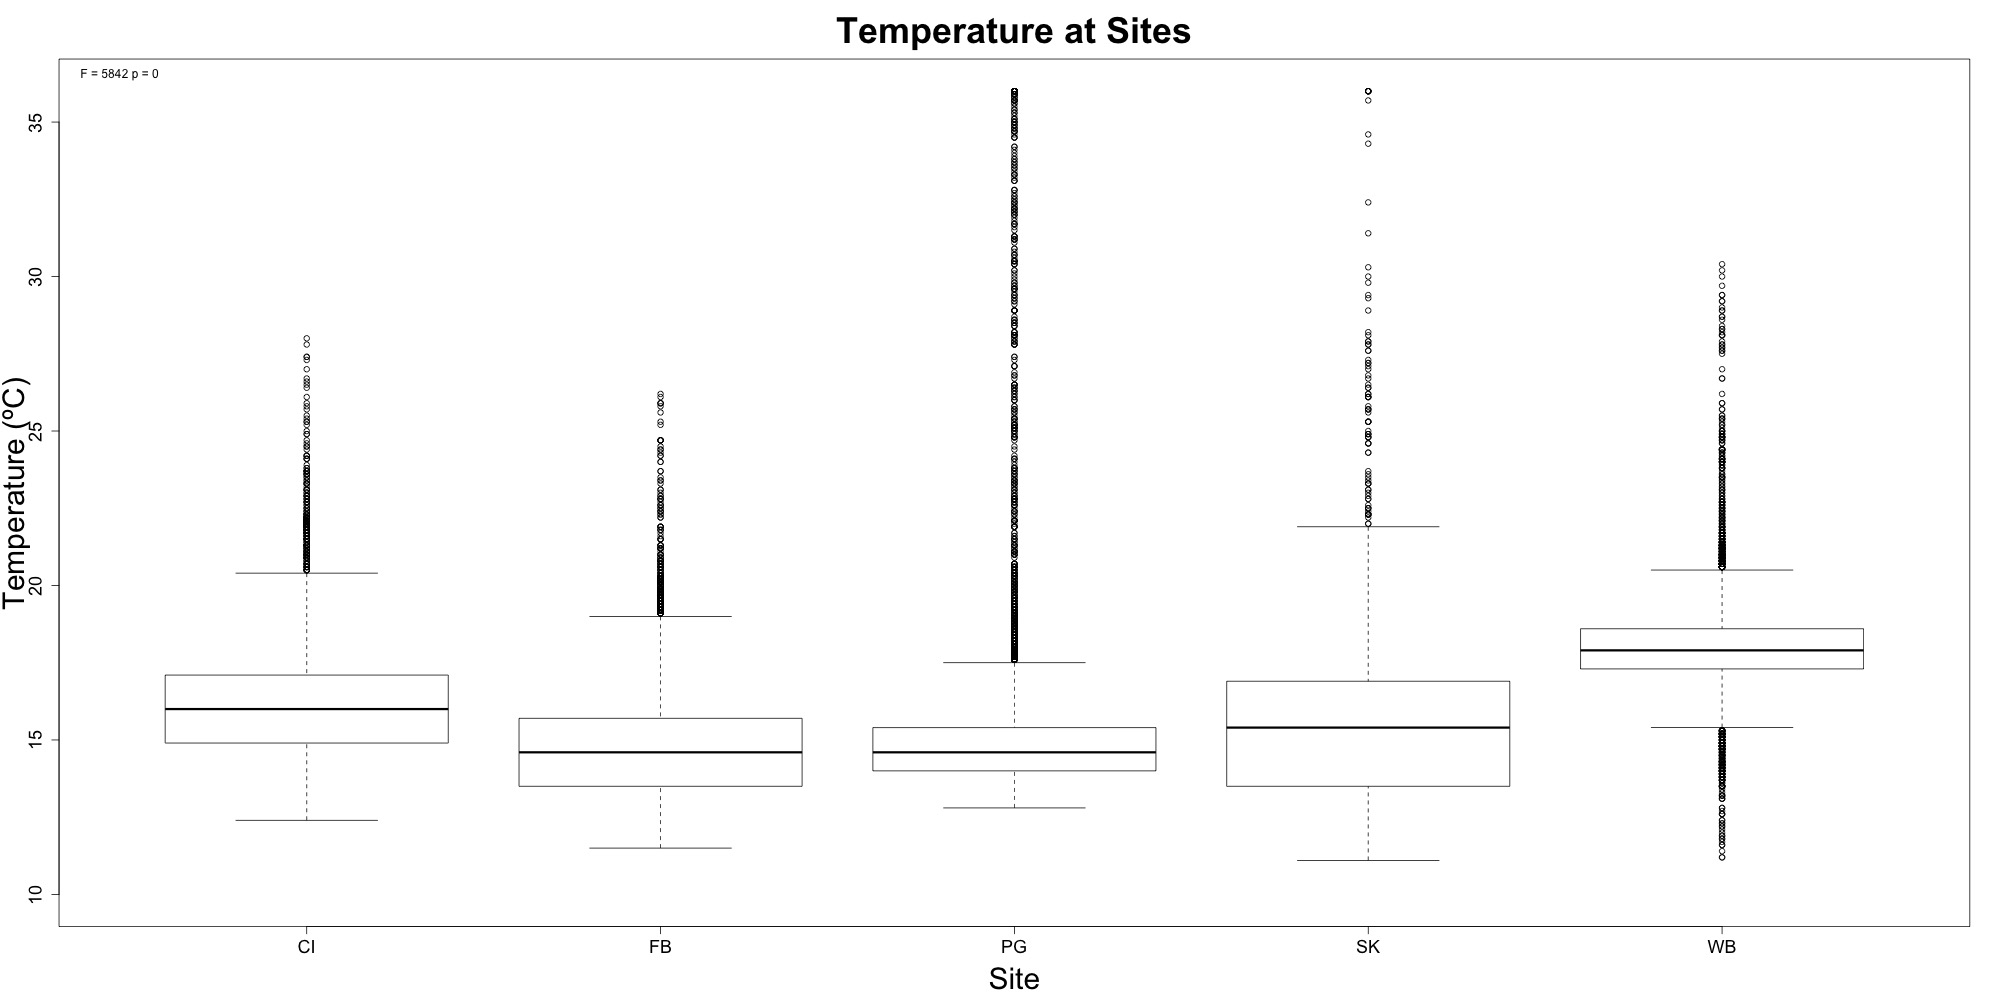
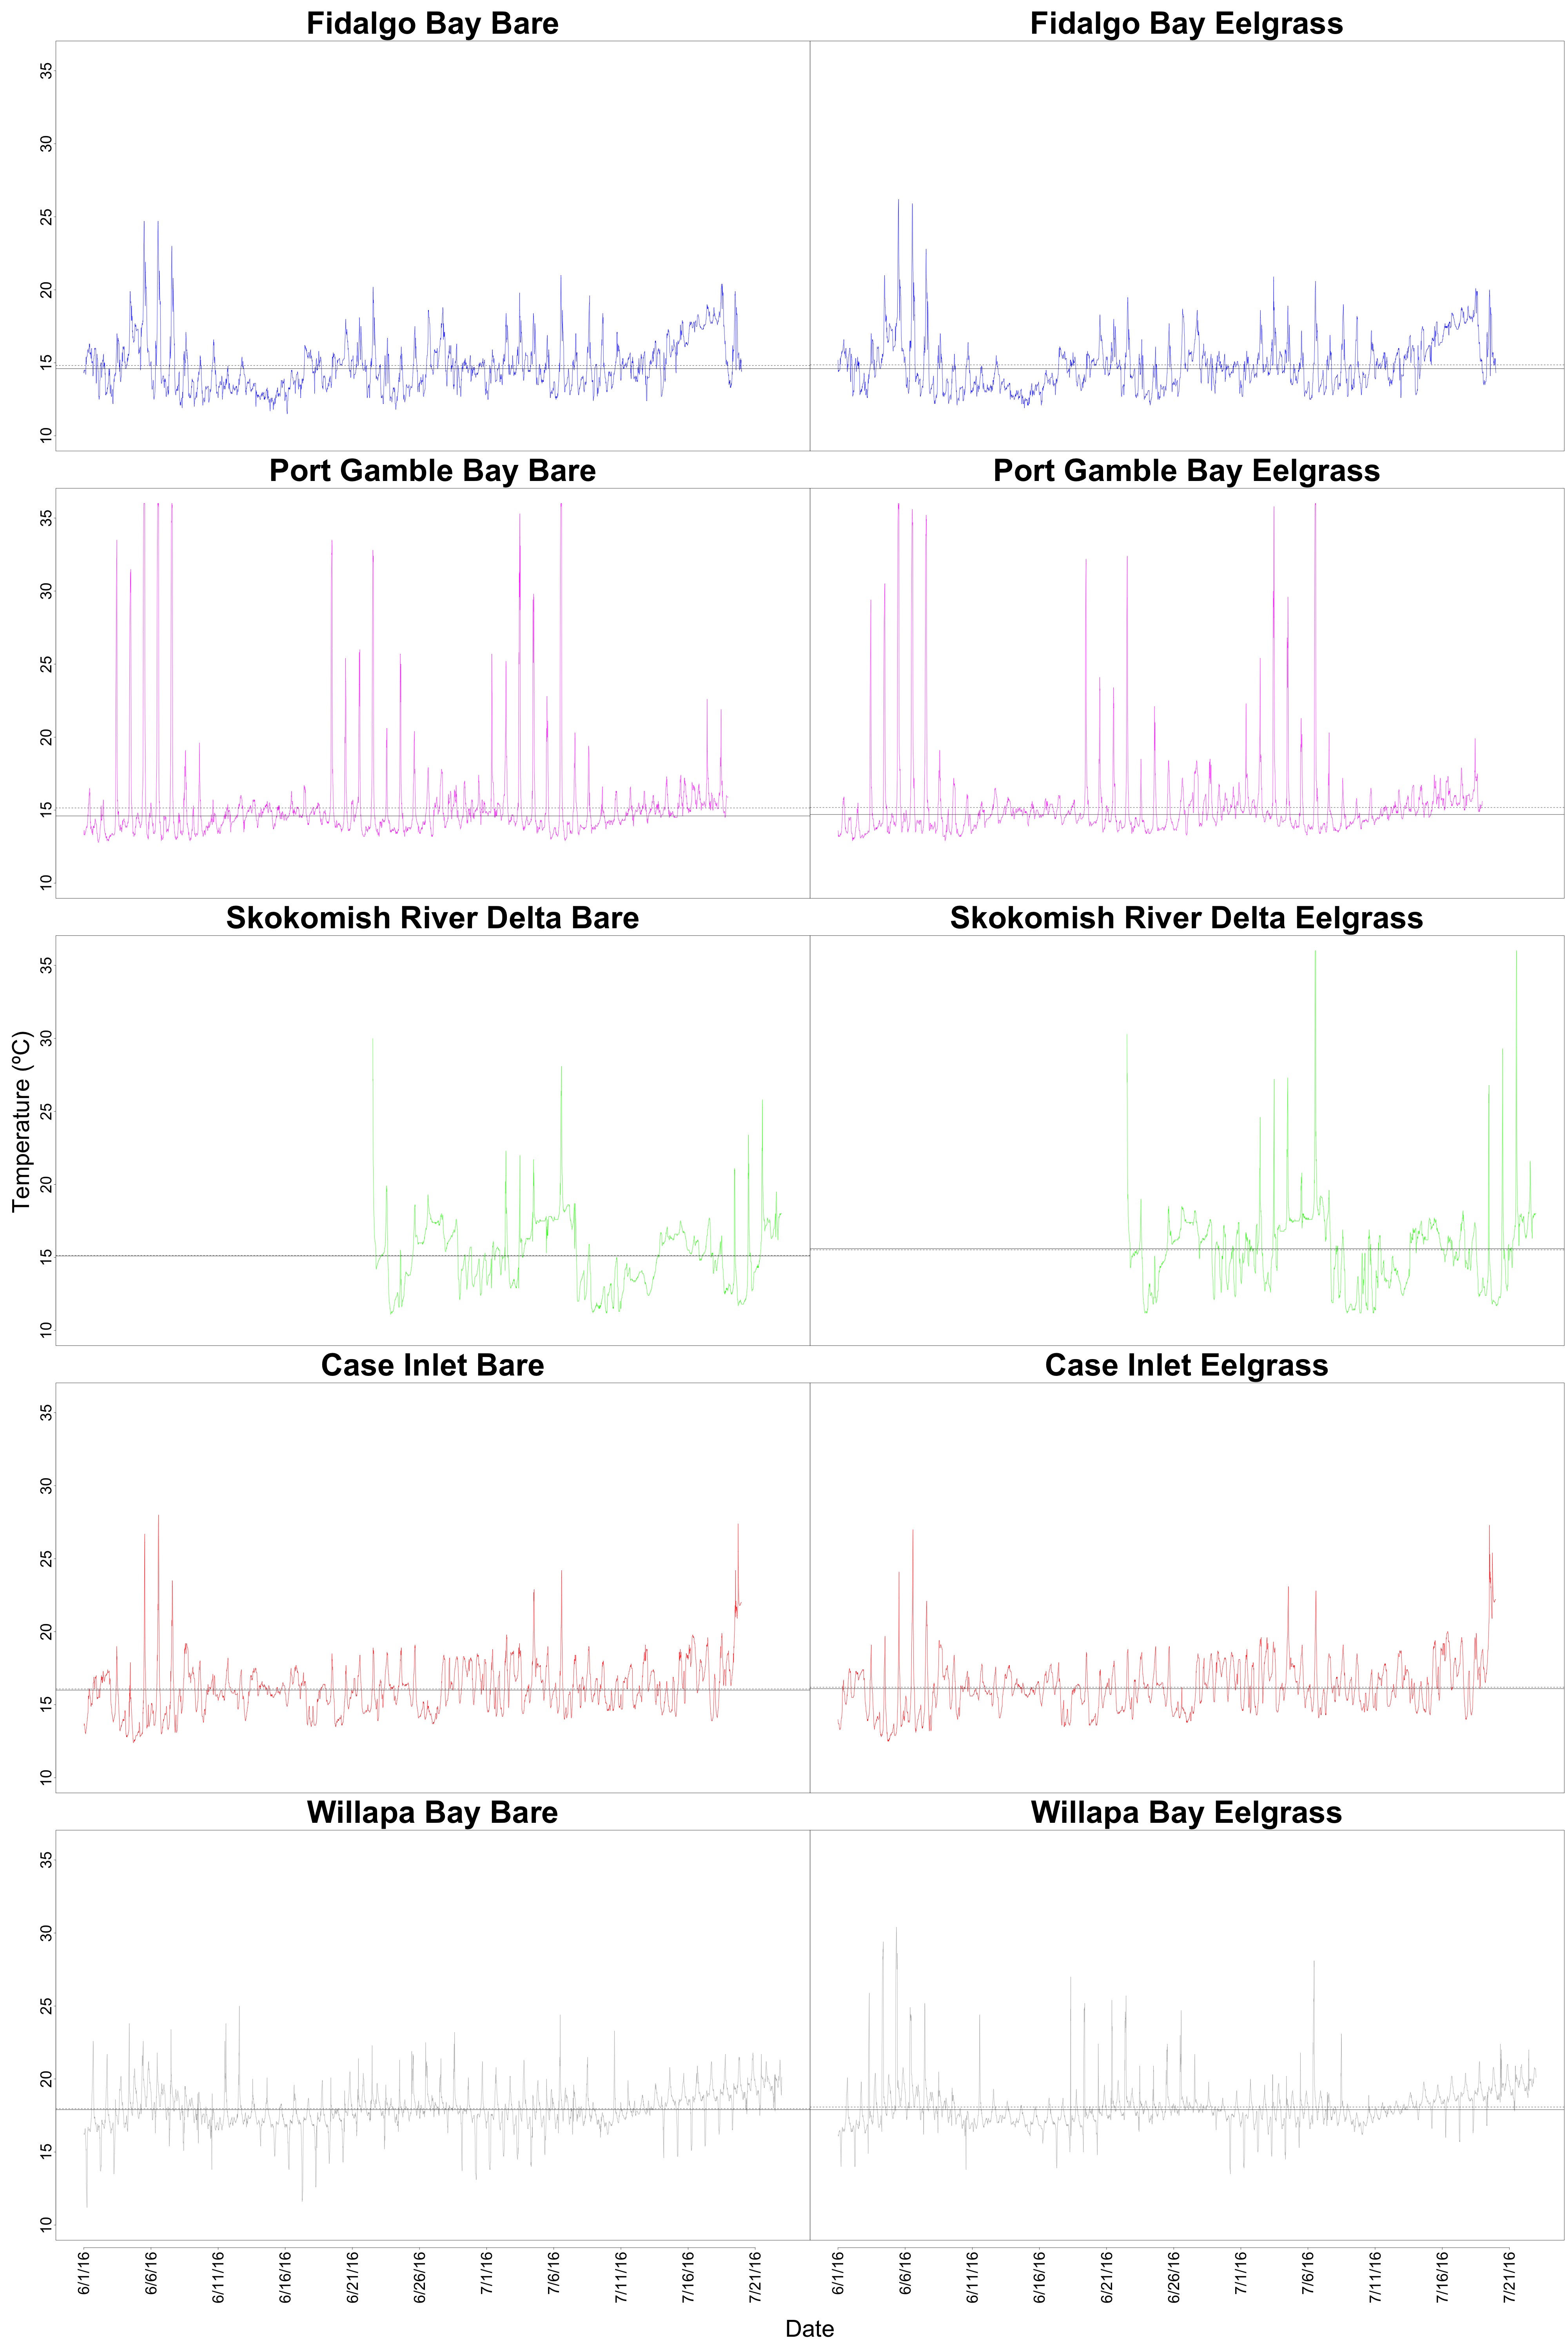
7 years ago - [ ] Plot environmental data in several ways that would indicate what environmental variable might be (or not be) associated with protein expression pattern (Willipa Bay different)
 yaaminiv