 sambrilleman
commented
2 years ago
sambrilleman
commented
2 years ago Hi @anddis - thanks for reporting this! It is a little odd. Not sure when someone will have time to look into the details of this, but I will tag it so that it can be added to the list of minor stan_surv bugs that need to be delved into.
 anddis
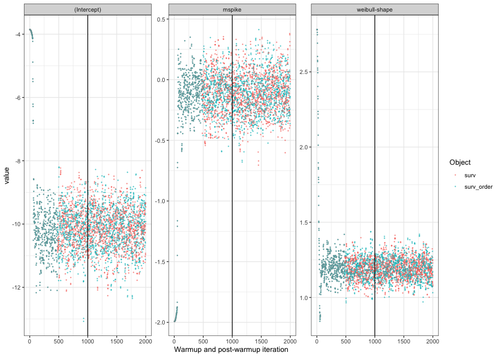
 ermeel86
Summary:
stan_survproduces different results after rearranging (sorting) the observations despite using the same seed.Description:
As per the summary. With the example data below, this issue happens with
basehaz = "weibull"orbasehaz = "bs", but not withbasehaz = "exp"orbasehaz = "weibull-aft".Reproducible example:
Relevant output from the last two
summaryfunctionsRStanARM Version:
2.21.2
R Version:
3.6.3
Operating System:
macOS 10.14.6