 marjan-georgiev
commented
6 years ago
marjan-georgiev
commented
6 years ago Try changing the barPadding input. The default is 8. If you change that to a lower number, the padding between the bars will be less, so there will be more space for the bars.
 salcio
 francovp
 asantiago323
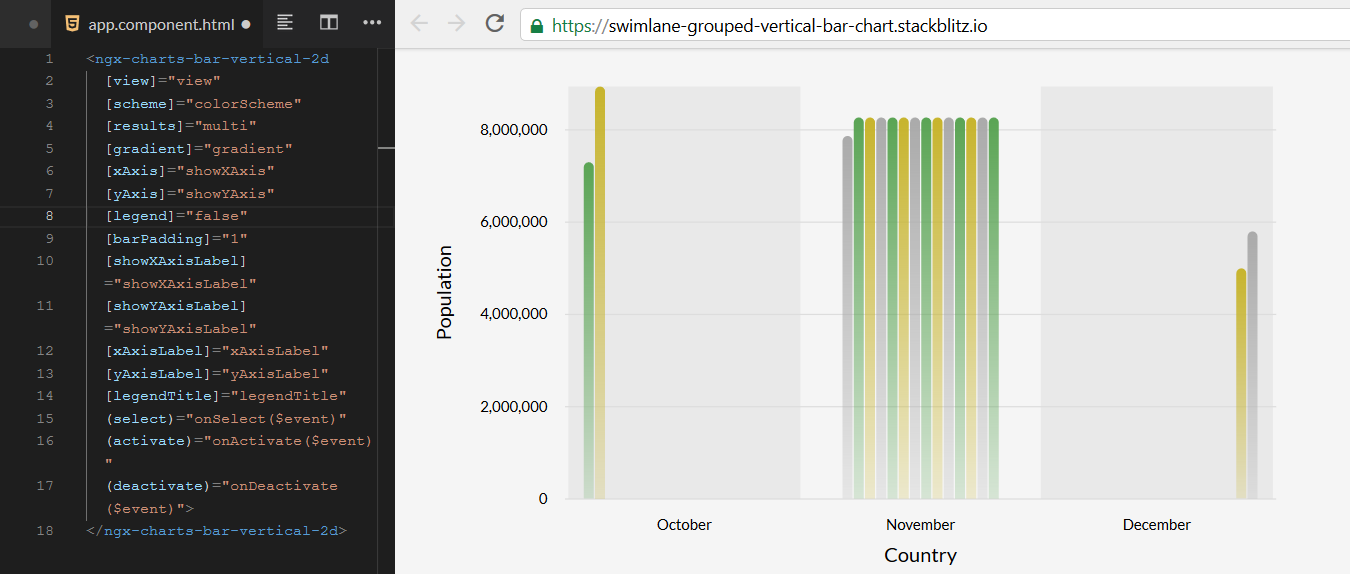


 LuisGustav0
 ceides9497
 Nickolaykuzmin
 Hello everyone, why ngx-charts group wrong calculating bar width??? Can't figure out... Ngx-chart single works correct!
 chriszrc
I'm submitting a ... (check one with "x")
Current behavior For grouped vertical bar chart when when there is a lot of data - in my case around 37 groups with 3 sets - the bars disappear. Changing the view size (width) of the chart expands the size for each group but the rectangle in which the bars are drown is still small.
Expected behavior When changing the size of the chart bars should appear when the width is big enough to fit all bars.
Reproduction of the problem On demo page (https://swimlane.github.io/ngx-charts/#/ngx-charts/bar-vertical-2d) turn on real-time data. After a while bars will not be visible.
Changing the size of the chart will help initially but after a while it doesn't matter how big the chart is bars won't be there.
I've also created a plunker https://plnkr.co/edit/yPraBTyJgRkXK1zxvr8G
What is the motivation / use case for changing the behavior? It doesn't work as I would expect it to.
Please tell us about your environment: Windows server 2012, WebStorm, NPM, .Net self hosted, Angular
ngx-charts version: 7.1.1
Angular version: 5.2.1
Browser: Tested/Reproduced under IE11 and Chrome 65.0.3325.181
Language: TypeScript 2.5.3