swimlane / ngx-charts

:bar_chart: Declarative Charting Framework for Angular
https://swimlane.github.io/ngx-charts/
MIT License
4.29k stars 1.15k forks source link

Line in Line Chart expands beyond the limits of the chart when using timeline and routing (Safari) #956

Open hecforga opened 6 years ago

hecforga commented 6 years ago

I'm submitting a ... (check one with "x")

Current behavior The line in a line chart is taking all the available width when selecting a timeline range. I have experienced this bug only in Safari, and when using the Angular Router. image

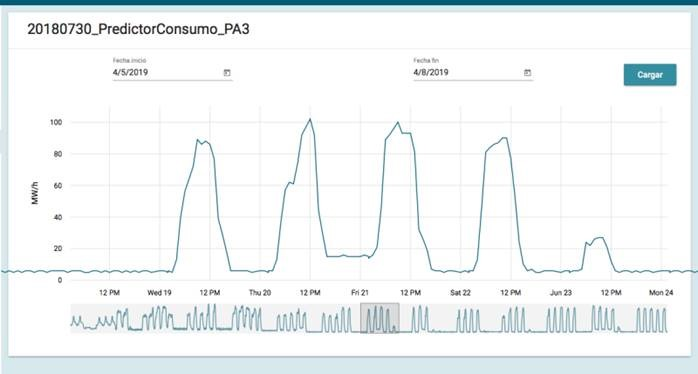
Expected behavior The line should not be visible beyond the limits of the chart. image

Reproduction of the problem Here is a stackblitz showing the bug in action: https://stackblitz.com/edit/angular-7ywpo1

What is the motivation / use case for changing the behavior? Using the Router is fundamental in a web app. ngx-charts should work with the Router in all browsers.

Please tell us about your environment: I experienced this bug using Safari in a Mac. In other browsers it works fine.

manolait commented 5 years ago

Hola hecforga,

No se si podrias ayudarme con una cosilla, sabes como se puede poner en español el timeline ahora mismo aparecen los meses en ingles, ademas sabrias como hacer al ponerte encima de un punto de la grafica te diga fecha y hora? ahora mismo sola da la fecha.

Un saludo y gracias.

lomarmo commented 5 years ago

Hi @hecforga

This problem seems to be caused by the fact that a <base> tag is used in Angular like this: <base href="/">

The LineChartComponent defines a Clip Path which is later used to hide the line series beyond the chart's limits. To do so, these two lines of code are included in the update() method:

    this.clipPathId = 'clip' + id().toString();
    this.clipPath = `url(#${this.clipPathId})`;

This causes the browser to look for the definition of the clipping path at the base url and, as it is unable to find it, it is therefore not applied. One solution to this would be to change those two lines with something like this:

    this.clipPathId = 'clip' + id().toString();
    const url = window.location.href;
    this.clipPath = `url(${url}#${this.clipPathId})`;

This expands to something like this: clip-path="url(path-to-current-page#clip-id)", which makes Safari look for the clip path definition in the current page instead.

lomarmo commented 5 years ago

Hola hecforga,

No se si podrias ayudarme con una cosilla, sabes como se puede poner en español el timeline ahora mismo aparecen los meses en ingles, ademas sabrias como hacer al ponerte encima de un punto de la grafica te diga fecha y hora? ahora mismo sola da la fecha.

Un saludo y gracias.

Hola @manolait

El componente LineChart tiene un atributo xAxisTickFormatting al que puedes asignar una función que recibe un parámetro de tipo genérico (any), y devuelve un string. Por ejemplo:

En el fichero html

<ngx-charts-line-chart [xAxisTickFormatting]="tickFormatting" [scheme]="colorScheme" [results]="data" [xAxis]="true" [yAxis]="true" [showYAxisLabel]="true" yAxisLabel="Revenue" [roundDomains]="true" [timeline]="true" >

En el fichero Typescript

  public tickFormatting(d: any) {
    if (d.constructor.name === 'Date') {
      return d.toLocaleDateString('es-ES');
    }
    return d.toLocaleString('es-ES');
  }

En este caso, el locale (es-ES) está puesto a fuego, pero lo lógico es que lo tengas en alguna propiedad del componente en función del idioma del usuario.

Para personalizar el tooltip que aparece sobre los puntos de la gráfica, puedes usar un ng-template con el identificador #tooltipTemplate. A esa plantilla se le pasa el item de la gráfica y puedes definir el html que quieres que se muestre. Te recomiendo que veas este enlace en el que se explica esta funcionalidad y hay un ejemplo: https://github.com/swimlane/ngx-charts/pull/399