 tbarbette
commented
2 years ago
tbarbette
commented
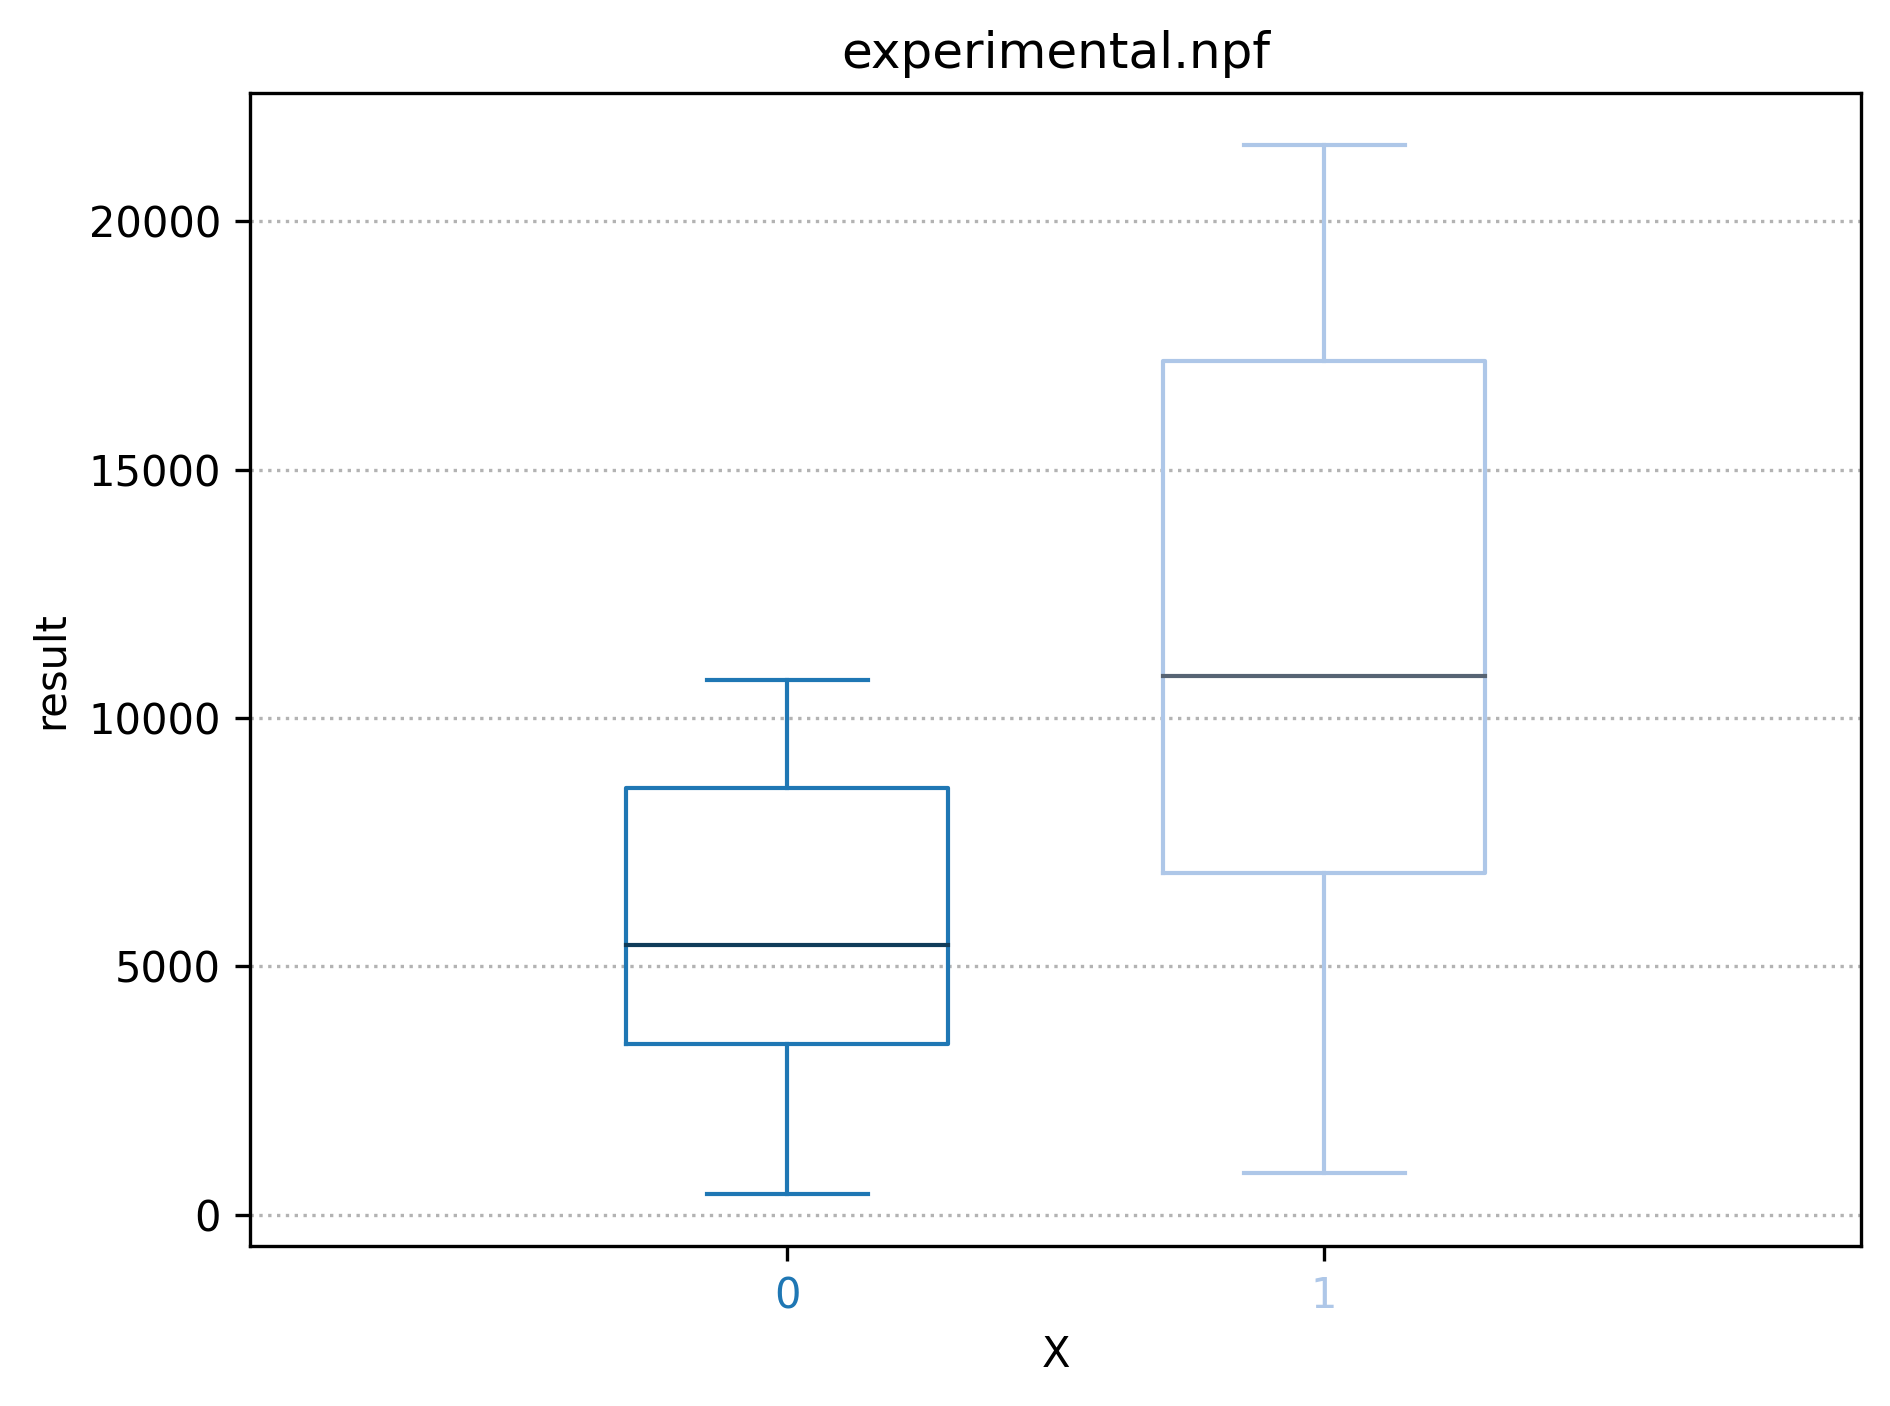
2 years ago This is done in f7fb1209e8a84c274dbe935f926d90b434ecb935, eg the following file (integration/experimental.npf) :
%variables
{
    ENORMOUS=[0-10000#]
    HUGE=[0-1000#]
    BIG=[0-100#]
    SMALL=[0-10#]
}
X={0,1}

%config
var_aggregate={ENORMOUS+HUGE+BIG+SMALL:all}

%script
echo "RESULT $(( ($X + 1) * ($ENORMOUS + $HUGE + $BIG + $SMALL) ))"
Will run 95 runs for X=0, and 95 runs for X=1, with values for ENOURMOUS, HUGE, BIG and SMALL draw from matrix.csv (built using the WSP algorithm) in the range defined above and ultimately produce this graph:
I'm moving the documentation on readthedocs (so it is parsed by google...), it's not finished but more information on the syntax and why we need var_aggregate can be found at https://npf.readthedocs.io/en/latest/variables.html#experimental-design
I'll close this issue and create a new one to support natively CDFs, as that last graph is not very ideal in some cases where we want to see how the distribution looks like. We would need for this graph a CDF with two lines (X=0 and X=1) showing how the points are distributed. One can already use --output-filename file.csv and plot it himself though.
Also now the matrix is taken from matrix.csv, so the number of points will always be 95, with a maximum of 20 variables. Having more or less matrix would be nice.
Thanks @mpiraux @qdeconinck for the idea and the help on the technique.
Use experimental design to cover a huge search space