 ted80810
commented
2 years ago
ted80810
commented
2 years ago Ready to start.
Open github-learning-lab[bot] opened 2 years ago
ted80810
commented
2 years ago Ready to start.
 github-learning-lab[bot]
commented
2 years ago
github-learning-lab[bot]
commented
2 years ago If you've written your own functions or scripts before, you may have run into the red breakpoint dot :red_circle: on the left side of your script window:
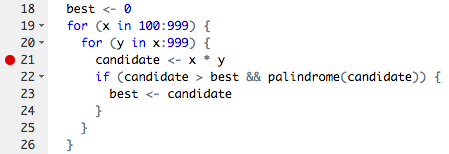
Breakpoints allow you to run a function (or script) up until the line of the breakpoint, and then the evaluation pauses. You are able to inspect all variables available at that point in the evaluation, and even step carefully forward one line at a time. It is out of scope of this exercise to go through exactly how to use debuggers, but they are powerful and helpful tools. It would be a good idea to read up on them if you haven't run into breakpoints yet.
In targets, you can't set a breakpoint in the "normal" way, which would be clicking on the line number after you sourced the script. Instead, you need to use the other method for debugging in R, which requires adding the function call browser() to the line where you'd like the function call to stop and specifying an additional argument when you call tar_make().
:warning: Check your RStudio version (go to the Help menu and click About RStudio). If you have a version earlier than v1.3.5, you may want to consider updating RStudio before proceeding to have the smoothest experience in debugging mode. :warning:
You have a working, albeit brittle, pipeline in your course repository. You can try it out with targets::tar_make(). This pipeline has a number of things you'll work to fix later, but for now, it is a useful reference. The pipeline contains a _targets.R file and several functions defined in .R files.
So, if you wanted to look at what download_files were created within the download_nwis_data() function, you could set a breakpoint by adding browser() to the "1_fetch/src/get_nwis_data.R" file (make sure to hit save for changes to take affect!). Hint: to quickly navigate to this function source code from your makefile, you can put your cursor on the name of the function then click F2 and it will take you to the correct location in the corresponding source file!

There is one more step to get your breakpoint to work in targets. You will need to add callr_function = NULL to your tar_make() call. When you run tar_make(callr_function = NULL), you will land right in the middle of line 8. Give it a try on your own.
To navigate while in browser mode, you can use the buttons at the top of your console pane:

:keyboard: Place a browser() in the for loop of the download_nwis_data() function. Build the pipeline and compare the size of data_out through each iteration of the loop using the debugger navigational features. When you are done, don't forget to remove the browser() command from that function and then save the R script. Then, comment here on where you think you might find browser() handy in future pipelines.
ted80810
commented
2 years ago I think the debugger feature will come in very handy when there is a need to fix a loop. If the loop is generating a url and downloading data from a collection, it would be very useful to observe if the url is being generated correctly after each iteration.
github-learning-lab[bot]
commented
2 years ago Seeing the structure of a pipeline as a visual is powerful. Viewing connections between targets and the direction data is flowing in can help you better understand the role of pipelines in data science work. Once you are more familiar with pipelines, using the same visuals can help you diagnose problems.
Below is a makefile that is very similar to the one you have in your code repository (the option configurations and source calls were removed for brevity, but they are unchanged):
p1_targets_list <- list(
  tar_target(
    site_data,
    download_nwis_data(),
  ),
  tar_target(
    site_info_csv,
    nwis_site_info(fileout = "1_fetch/out/site_info.csv", site_data),
    format = "file"
  ),
  tar_target(
    nwis_01427207_data_csv,
    download_nwis_site_data('1_fetch/out/nwis_01427207_data.csv'),
    format = "file"
  ),
  tar_target(
    nwis_01432160_data_csv,
    download_nwis_site_data('1_fetch/out/nwis_01432160_data.csv'),
    format = "file"
  )
)

p2_targets_list <- list(
  tar_target(
    site_data_clean,
    process_data(site_data)
  ),
  tar_target(
    site_data_annotated,
    annotate_data(site_data_clean, site_filename = site_info_csv)
  ),
  tar_target(
    site_data_styled,
    style_data(site_data_annotated)
  )
)

p3_targets_list <- list(
  tar_target(
    figure_1_png,
    plot_nwis_timeseries(fileout = "3_visualize/out/figure_1.png", site_data_styled),
    format = "file"
  )
)
Two file targets (nwis_01427207_data_csv and nwis_01432160_data_csv) were added to this makefile, but there were no changes to the functions, since download_nwis_site_data() already exists and is used to create a single file that contains water monitoring information for a single site.
The targets package has a nice function called tar_glimpse() that we haven't covered yet (if you get an error when you try to use it, run install.packages("visNetwork") and then try again). It produces a dependency diagram for the target(s) you pass to the allow argument (it will show all of them by default). For this modified makefile, calling that function with the default arguments produces:
targets::tar_glimpse()
If you run the same command, you'll see something similar but the two new files won't be included.
Seeing this diagram helps develop a greater understanding of some of the earlier concepts from intro-to-targets-pipelines. Here, you can clearly see the connection between site_data and figure_1_png. The figure_1 plot needs all of the previous steps to have run in order to build. The arrows communicate the connections (or "dependencies") between targets, and if a target doesn't have any arrows connected to it, it isn't depended on by another target and it doesn't depend on any another targets. The two new .csv files are both examples of this, and in the image above they are floating around with no connections. A floater target like these two will still be built by tar_make() if they are included in the final target list (e.g., here they appear in p1_targets_list which is included in the final target list returned at the end of _targets.R)
The diagram also shows how the inputs of one function create connections to the output of that function. site_data is used to build site_data_clean (and is the only input to that function) and it is also used as an input to "1_fetch/out/site_info.csv", since the nwis_site_info() function needs to know what sites to get information from. These relationships result in a split in the dependency diagram where site_data is directly depended on by two other targets.
Another useful technique for examining your pipeline connections is to use tar_manifest(), which returns a data.frame of information about the targets. While visual examination gives a complete overview, sometimes it is also useful to have programmatic access to your target names. Below is the table that is returned from tar_manifest() (remember that yours might be slightly different because it won't include the two new files).
tar_manifest()

# A tibble: 8 x 3
  name                  command                                                                            pattern
  <chr>                 <chr>                                                                              <chr>
1 site_data             "download_nwis_data()"                                                             NA
2 nwis_01432160_data_c~ "download_nwis_site_data(\"1_fetch/out/nwis_01432160_data.csv\")"                  NA
3 nwis_01427207_data_c~ "download_nwis_site_data(\"1_fetch/out/nwis_01427207_data.csv\")"                  NA
4 site_data_clean       "process_data(site_data)"                                                          NA
5 site_info_csv         "nwis_site_info(fileout = \"1_fetch/out/site_info.csv\",  \\n     site_data)"      NA
6 site_data_annotated   "annotate_data(site_data_clean, site_filename = site_info_csv)"                    NA
7 site_data_styled      "style_data(site_data_annotated)"                                                  NA
8 figure_1_png          "plot_nwis_timeseries(fileout = \"3_visualize/out/figure_1.png\",  \\n     site_d~ NA
:keyboard: comment on what you learned from exploring tar_glimpse() and tar_manifest().
ted80810
commented
2 years ago tar_glimpse() displays a dependency graph, which is useful to visual the workflow. It is also useful to observe any problems or targets that have no dependencies. tar_manifest() lists targets and the associated command/function.
github-learning-lab[bot]
commented
2 years ago In the image contained within the previous comment, all of the shapes are circles of the same color. tar_glimpse() is useful to verify your pipeline connections, but once you start building your pipeline tar_visnetwork() creates a dependency diagram with more information and styles the shapes in ways to signify which targets are out of date or don't need to rebuild.
We've put some fragile elements in the pipeline that will be addressed later, but if you were able to muscle through the failures with multiple calls to tar_make(), you likely were able to build the figure at the end of the dependency chain. For this example, we'll stop short of building the figure_1_png target by calling tar_make('site_data_styled') instead to illustrate an outdated target.
The output of tar_visnetwork() after running tar_make('site_data_styled') (and having never built all targets by running tar_make() with no inputs) looks like this:

Only the colors have changed from the last example, signifying that the darker targets are "complete", but that figure_1_png and the two data.csv files still don't exist.
The targets package has a useful function called tar_outdated() which will list the incomplete targets that need to be updated in order to satisfy the output (once again, the default for this function is to reference all targets in the pipeline).
tar_outdated()
[1] "nwis_01432160_data_csv" "nwis_01427207_data_csv" "figure_1_png"
This output tells us the same thing as the visual, namely that these three targets :point_up: are incomplete/outdated.
A build of the figure with tar_make('figure_1_png') will update the target dependencies, result in a tar_visnetwork() output which darkens the fill color on the figure_1_png shape, and cause a call to tar_outdated("figure_1_png") to result in an empty character vector, character(0), letting the user know the target is not outdated.
The figure_1_png target can become outdated again if there are any modifications to the upstream dependencies (follow the arrows in the diagram "upstream") or to the function plot_nwis_timeseries(). Additionally, a simple update to the value of one of the "fixed" arguments will cause the figure_1_png target to become outdated. Here the height argument was changed from 7 to 8:
tar_visnetwork("3_visualize/out/figure_1.png")
In the case of fixed arguments, changing the argument names, values, or even the order they are specified will create a change in the function definition and cause the output target to be considered outdated. Adding comments to the function code does not cause the function to be seen as changed.
:keyboard: using tar_visnetwork() and tar_outdated() can reveal unexpected connections between the target and the various dependencies. Comment on some of the different information you'd get from tar_visnetwork() that wouldn't be available in the output produced by tar_glimpse() or tar_manifest().
In this section, we're going to go one by one through a series of tips that will help you avoid common pitfalls in pipelines. These tips will help you in the next sections and in future work. A quick list of what's to come:
tar_visnetwork()andtar_outdated()to further interrogate the status of pipeline targets:keyboard: add a comment to this issue and the bot will respond with the next topic
I'll sit patiently until you comment