 aseaday
commented
1 year ago
aseaday
commented
1 year ago I think we could do a exporter. But we need to have a good design. Because I think we should reduce the difficulty for users to ananlyze the data but could know what he could do to improve the effiency or progress in a look. Another thing I cared about is that should we also monitor the model or computing flow in the application users runs?
 VoVAllen
 For a app running in envd, could we provide a python agent or sidecar to detect the computiing ops in some famlilar framework. Or we just offer a standard format and display the computing operator flow but users could develop the probe to find the computing graph for the framework they are using.
 gaocegege
 zwpaper
 kemingy
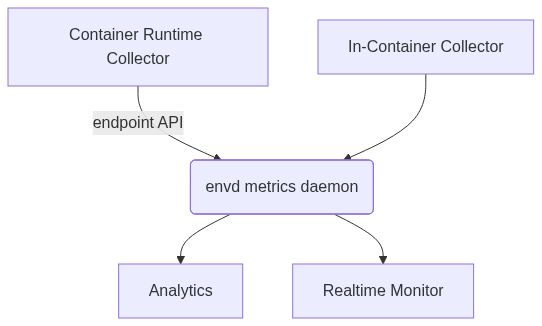
Description
Support collecting related metrics (cpu/gpu/memory/disk) and demonstrate it to users
Message from the maintainers:
Love this enhancement proposal? Give it a 👍. We prioritise the proposals with the most 👍.