 nfelt
commented
4 years ago
nfelt
commented
4 years ago @qiuminxu could you take a look?
Open ProNoobLi opened 4 years ago
nfelt
commented
4 years ago @qiuminxu could you take a look?
 jray319
commented
4 years ago
jray319
commented
4 years ago I think it is because the epoch end time is captured after profiler.stop() and profiler.save(). Can you try doing "end = time.time()" before them?
 ProNoobLi
commented
4 years ago
ProNoobLi
commented
4 years ago I think it is because the epoch end time is captured after profiler.stop() and profiler.save(). Can you try doing "end = time.time()" before them?
Anyway it takes a longer time, moving the end time doesn't decrease the total execution time. Could you please explain why it is killed using profiler
 qiuminxu
commented
4 years ago
qiuminxu
commented
4 years ago Thanks for sharing the code, it is very helpful.
I've tried running your code locally. (The only change is I changed the number of GPUs to 1, since I only have one GPU locally.)
It doesn't take as bad as 146s/epoch, but 5s/epoch on my machine.
What's the machine you're running the experiment on? The other thing is tf 2.0.0 is an earlier version, would you try again with the latest tf-nightly?
My log is attached below:
2020-02-26 11:22:52.345740: I tensorflow/stream_executor/platform/default/dso_loader.cc:44] Successfully opened dynamic library libcublas.so.10 2020-02-26 11:22:52.562497: I tensorflow/stream_executor/platform/default/dso_loader.cc:44] Successfully opened dynamic library libcudnn.so.7 Epoch 1, Loss: 0.569322943687439, Accuracy: 0.0, Test Loss: 0.0, Test Accuracy: 0.0, Time: 7.588510990142822 secs/epoch Epoch 2, Loss: 0.36053138971328735, Accuracy: 0.0, Test Loss: 0.0, Test Accuracy: 0.0, Time: 2.5154144763946533 secs/epoch Epoch 3, Loss: 0.31529784202575684, Accuracy: 0.0, Test Loss: 0.0, Test Accuracy: 0.0, Time: 2.498485803604126 secs/epoch 2020-02-26 11:23:02.175240: I tensorflow/core/profiler/lib/profiler_session.cc:159] Profiler session started. 2020-02-26 11:23:02.175296: I tensorflow/core/profiler/internal/gpu/cupti_tracer.cc:1363] Profiler found 1 GPUs 2020-02-26 11:23:02.208739: I tensorflow/stream_executor/platform/default/dso_loader.cc:44] Successfully opened dynamic library libcupti.so.10.1 2020-02-26 11:23:05.627221: I tensorflow/core/profiler/internal/gpu/cupti_tracer.cc:1479] CUPTI activity buffer flushed 2020-02-26 11:23:05.914650: I tensorflow/core/profiler/internal/gpu/device_tracer.cc:210] GpuTracer has collected 42279 callback api events and 42279 activity events. Epoch 4, Loss: 0.28605473041534424, Accuracy: 0.0, Test Loss: 0.0, Test Accuracy: 0.0, Time: 5.1658430099487305 secs/epoch Epoch 5, Loss: 0.26452019810676575, Accuracy: 0.0, Test Loss: 0.0, Test Accuracy: 0.0, Time: 2.507859706878662 secs/epoch
ProNoobLi
commented
4 years ago Thanks for sharing the code, it is very helpful.
I've tried running your code locally. (The only change is I changed the number of GPUs to 1, since I only have one GPU locally.)
It doesn't take as bad as 146s/epoch, but 5s/epoch on my machine.
What's the machine you're running the experiment on? The other thing is tf 2.0.0 is an earlier version, would you try again with the latest tf-nightly?
My log is attached below:
2020-02-26 11:22:52.345740: I tensorflow/stream_executor/platform/default/dso_loader.cc:44] Successfully opened dynamic library libcublas.so.10 2020-02-26 11:22:52.562497: I tensorflow/stream_executor/platform/default/dso_loader.cc:44] Successfully opened dynamic library libcudnn.so.7 Epoch 1, Loss: 0.569322943687439, Accuracy: 0.0, Test Loss: 0.0, Test Accuracy: 0.0, Time: 7.588510990142822 secs/epoch Epoch 2, Loss: 0.36053138971328735, Accuracy: 0.0, Test Loss: 0.0, Test Accuracy: 0.0, Time: 2.5154144763946533 secs/epoch Epoch 3, Loss: 0.31529784202575684, Accuracy: 0.0, Test Loss: 0.0, Test Accuracy: 0.0, Time: 2.498485803604126 secs/epoch 2020-02-26 11:23:02.175240: I tensorflow/core/profiler/lib/profiler_session.cc:159] Profiler session started. 2020-02-26 11:23:02.175296: I tensorflow/core/profiler/internal/gpu/cupti_tracer.cc:1363] Profiler found 1 GPUs 2020-02-26 11:23:02.208739: I tensorflow/stream_executor/platform/default/dso_loader.cc:44] Successfully opened dynamic library libcupti.so.10.1 2020-02-26 11:23:05.627221: I tensorflow/core/profiler/internal/gpu/cupti_tracer.cc:1479] CUPTI activity buffer flushed 2020-02-26 11:23:05.914650: I tensorflow/core/profiler/internal/gpu/device_tracer.cc:210] GpuTracer has collected 42279 callback api events and 42279 activity events. Epoch 4, Loss: 0.28605473041534424, Accuracy: 0.0, Test Loss: 0.0, Test Accuracy: 0.0, Time: 5.1658430099487305 secs/epoch Epoch 5, Loss: 0.26452019810676575, Accuracy: 0.0, Test Loss: 0.0, Test Accuracy: 0.0, Time: 2.507859706878662 secs/epoch
Hey, thanks for your feedback. Updating to tf2.1 works. The running time of one GPU is similar to yours:
 However, when using multi-gpu. Error is like this:
 When I google about this error online, it seems to be resulted from explosion of memory stack. If in this case, it's easy to understand why it is killed, but why profiler works fine with Tensorboard callback of kerasAPI but such simple training loop doesn't? Could you please try the code under multi-gpu environment.
ProNoobLi
commented
4 years ago  Sometimes it just freezes there without any feedback. I simply change one gpu to 2 gpu
qiuminxu
commented
4 years ago I saw you're using cupti 10.1, would you try cupti 10.2? CUPTI 10.2 includes performance improvements and bug fixes for multiple GPU tracing.
qiuminxu
commented
4 years ago Hi @JiayuanSternLi, just want to check back on your issue, has the issue been resolved?
If not, would you try set export TF_GPU_CUPTI_USE_ACTIVITY_API=false on your host?
In addition, we have recently launched TF 2.2 profiler with more feature. It may provide more performance details and analysis on your model.
Github: https://github.com/tensorflow/profiler Profiling Guide: https://tensorflow.org/guide/profiler Colab tutorial: https://www.tensorflow.org/tensorboard/tensorboard_profiling_keras
ProNoobLi
commented
4 years ago Hi @JiayuanSternLi, just want to check back on your issue, has the issue been resolved? If not, would you try set
export TF_GPU_CUPTI_USE_ACTIVITY_API=falseon your host?In addition, we have recently launched TF 2.2 profiler with more feature. It may provide more performance details and analysis on your model.
Github: https://github.com/tensorflow/profiler Profiling Guide: https://tensorflow.org/guide/profiler Colab tutorial: https://www.tensorflow.org/tensorboard/tensorboard_profiling_keras
Thank you for your reply. You still remember me :). Sorry I didn't try the profiler since then...
qiuminxu
commented
4 years ago No problem. Let me know the next time you try :).
 ethanyanjiali
commented
4 years ago
ethanyanjiali
commented
4 years ago @qiuminxu Thanks Qiumin for these pointers. I also watched your recent talk on this profiler and it was great.
However, is there any docs about using this profiler with custom training loop? I'm using custom loop with MirroredStrategy and distributed dataset API, but seeing a significant slowness when training on ImageNet compared with similar implementation in PyTorch, MXNet and even TF 1 (with Hororvod). Or do I have to change to Keras API for training in order to use profiler?
ethanyanjiali
commented
4 years ago for those who want to use profiler with custom loop, It looks like the tutorial has been updated:
with tf.profiler.experimental.Profile('logdir'):
    # Train the model here
    pass
michal-kierzynka
commented
4 years ago
michal-kierzynka
commented
4 years ago @JiayuanSternLi @ethanyanjiali were you able to run the profiler on custom training loop and eventually to get MirroredStrategy scale up properly on such loops?
I found this issue, as I'm struggling with a MirroredStrategy giving no speedup on multiple GPUs (V100) and with custom training loop of course, even though I followed this tutorial in detail: https://www.tensorflow.org/tutorials/distribute/custom_training
ethanyanjiali
commented
4 years ago i got it working but it's quite unstable, especially when the graph is large. for mirrored strategy, make sure you are using graph mode instead of eager mode. in eager mode it just runs sequentially. another suggestion is to use PyTorch if you can.
michal-kierzynka
commented
4 years ago OK, I got it working stable by switching to graph mode. @tf.function decorated distributed_train_step was the key, but I had to restructure the code a bit to adapt it to graph mode.
Additional problem I had was with recompiling my model between training epochs, that is between calls to distributed_train_step decorated with @tf.function. A post that helped me a lot with this was: https://github.com/tensorflow/tensorflow/issues/27120#issuecomment-540071844 I'm leaving the reference here hoping this can save somebody's time.
Consider Stack Overflow for getting support using TensorBoard—they have a larger community with better searchability:
https://stackoverflow.com/questions/tagged/tensorboard
Do not use this template for for setup, installation, or configuration issues. Instead, use the “installation problem” issue template:
https://github.com/tensorflow/tensorboard/issues/new?template=installation_problem.md
To report a problem with TensorBoard itself, please fill out the remainder of this template.
Environment information (required)
Please run
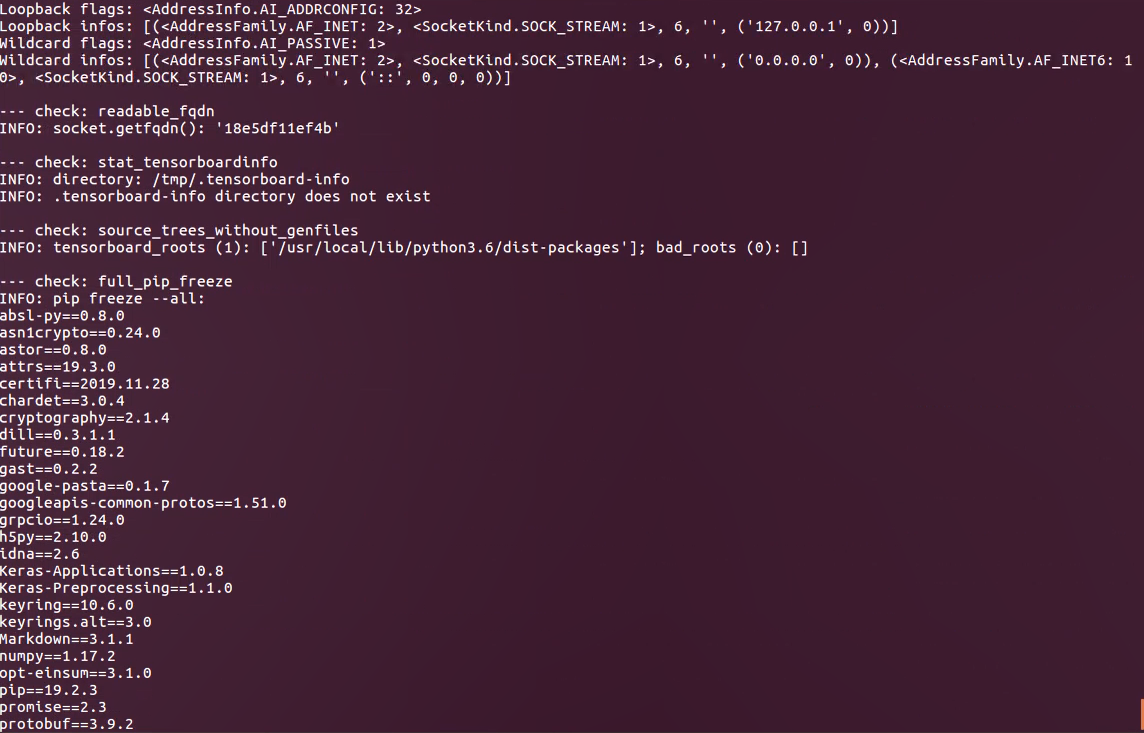
diagnose_tensorboard.py(link below) in the same environment from which you normally run TensorFlow/TensorBoard, and paste the output here: Sorry for that I cannot copy terminal from my remote desktop, so the screenshot is attached here:https://raw.githubusercontent.com/tensorflow/tensorboard/master/tensorboard/tools/diagnose_tensorboard.py
For browser-related issues, please additionally specify:
Issue description
I am trying to get profiler result of my custom training loop. My complex training loop(larger model, larger datasets) is stuck and then killed. Please note that I only run profiler for one epoch: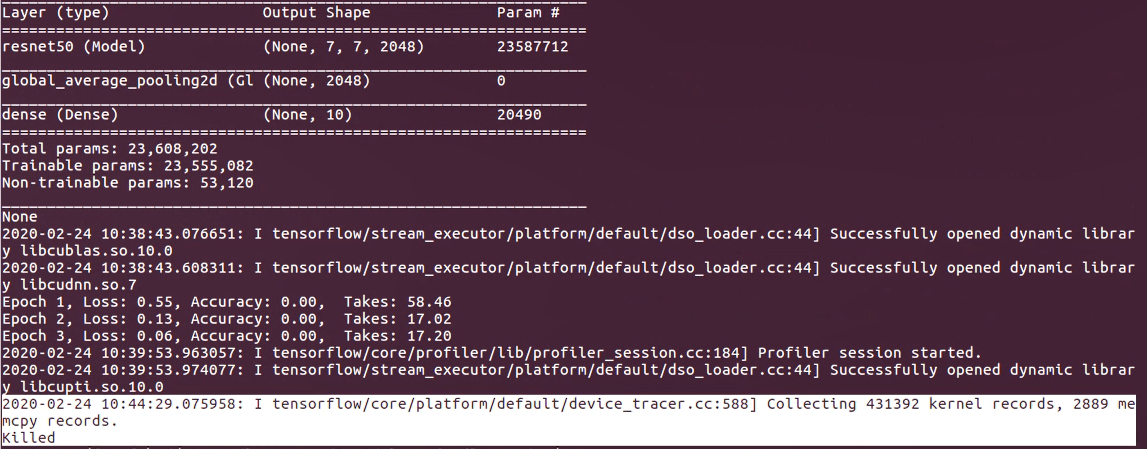
In this case for comparison, I tried training on a simple traing loop(mnist datasets, simple model). Profiler works but takes much longer time. 146s/epoch vs 1.8s/epoch: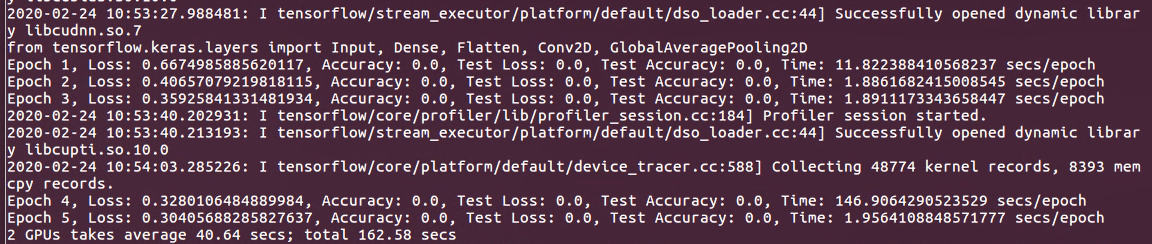
Why does profiler slow down the runtime greatly in custom training loop while keras callbacks doesn't???
Please note that the code is copied from tf official tutorial from the TF website combined with distributed custom training loop and profiler.Code is attached as below: