texstudio-org / texstudio

TeXstudio is a fully featured LaTeX editor. Our goal is to make writing LaTeX documents as easy and comfortable as possible.
http://www.texstudio.org/
GNU General Public License v3.0
2.78k stars 344 forks source link

Live rendering with TeXpresso #3616

Open leanhdung1994 opened 5 months ago

leanhdung1994 commented 5 months ago

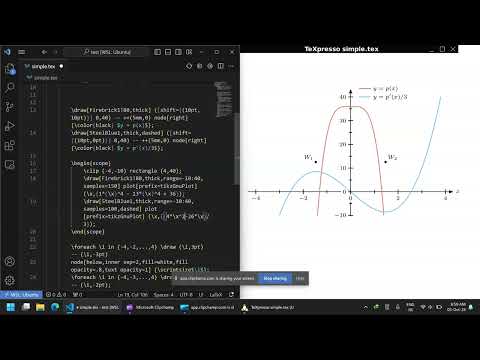
I am a fan of WYSIWYG feature. Unfortunately, Texstudio only has an option Auto-recompile document on changes, which is not a kind of incremental rendering: image

Recently, I have come across TeXpresso which offers

  1. Live rendering:

https://github.com/texstudio-org/texstudio/assets/28704090/ee90fda9-af68-4f4f-864a-4881d0fc4a9f

  1. Synchronization from document to editor:

https://github.com/texstudio-org/texstudio/assets/28704090/20af08fa-e966-4574-9314-3b90b1a66212

  1. Synchronization from editor to document:

https://github.com/texstudio-org/texstudio/assets/28704090/e97e7cc5-3c5c-46be-80ef-22398b9384a5

I hope that the community could integrate those great features of TeXpresso into Texstudio. This would be very helpful for editing LaTex documents with complicated equations. Thank you so much for your consideration!

pizdjuk commented 1 week ago

I'm not sure it makes any big sense. Latex is not wysiwyg system and never will. And I can barely imagine, how this can be efficient. Some document with a little bit more then 5 files, renders on a i7 machine like 5 seconds.

Such a feature is simply a power eater I think. But probably I'm wrong and there is some speed engine, that is connected byside.

leanhdung1994 commented 1 week ago

I'm not sure it makes any big sense. Latex is not wysiwyg system and never will. And I can barely imagine, how this can be efficient. Some document with a little bit more then 5 files, renders on a i7 machine like 5 seconds.

Such a feature is simply a power eater I think. But probably I'm wrong and there is some speed engine, that is connected byside.

It totally makes sense for two reasons.

  1. For long equations, we have to see the rendering to determine manually where to break lines. This makes WYSIWYG essential.

image

  1. WYSIWYG feature is usually powered by incremental compiling. This is very efficient in terms of computing power. During writing a paper, it is almost always the case that you re-compile the tex file many times to see the rendering output. Traditionally, each re-compilation will process the whole tex file from scratch. With incremental compiling, the engine will only "re-render the modified portions of the document".

You can see how TeXpresso live renders extremely fast a (very big) tex file (> 900 pages of complicated equations) at https://www.reddit.com/r/LaTeX/comments/1dn937i/live_rendering_a_very_big_tex_file_900_pages_of/.

octaeder commented 1 week ago

I think this is already answered here #3351. In txs you can use the preview feature which allows to quickly render environments or selected text and show the result instream (i.e. below the selected text), in the preview panel or in the integrated pdf viewer (or as a tooltip).

(edited) I don't know how others make it possible to render portions of the document. If you use a latex compile, you need a preamble (the code before the document environment). For example the instream preview of txs is of acceptable speed, but may not give what your document looks like on a full compile. Since the compiler sees only part of the document paragraph indentation or other formatting information may miss. This may affect line breaks for example. Also small additions to the preamble are done. Preview in the integrated pdf viewer uses the original preamble without change. Reading all the packages takes time, and compiling takes even more time when you use luatex instead of pdftex. To speed up things it is possible to store a compile of the preamble. But this doesn't work in all cases, especially not with pgf/tikz picture package.

leanhdung1994 commented 1 week ago

I think this is already answered here #3351. In txs you can use the preview feature which allows to quickly render environments or selected text and show the result instream (i.e. below the selected text), in the preview panel or in the integrated pdf viewer (or as a tooltip).

I don't know how others make it possible to render portions of the document. If you use a latex compile, you have to decide what you use as preamble (the code before the document environment). For example the instream preview of txs uses a very small preamble and not the original one which may load many packages. This is of acceptable speed, but may not give what your document looks like on a full compile. The compile may miss page size, paragraph indentation, or other formatting information from the preamble (especially if you are looking for line breaks), not to mention your special command definitions you use.

Preview in the integrated pdf viewer uses the original preamble from your document. This may need more time when you use many packages and even more when you use luatex instead of pdftex. To speed up things it is possible to store a compile of the preamble. But this doesn't work in all cases, especially not with pgf/tikz picture package.

I hope you can have a look at this video https://youtu.be/L0IK6nv1zuc?si=YfEuKYNt3DHAQDT2&t=34 to see how amazing live rendering of TeXpresso is. The source code of TeXpresso is already there, and it remains for us to adapt this source code to txs...

octaeder commented 1 week ago

@leanhdung1994 can you show in a video editing this picture?

% pdflatex
\documentclass[10pt,a5paper]{report}
\usepackage[x11names,table]{xcolor}
\usepackage{tikz}
\usetikzlibrary{math,calc,arrows.meta}
\pagestyle{empty}
\begin{document}
    \begin{tikzpicture}[domain=-4:4,>=Latex,x=10.mm,y=1.mm,thick]\scriptsize
        \draw[semithick,->] ([xshift=-10pt]-4, 0) -- ([xshift=10pt] 4, 0) node[right] {$x$};
        \draw[semithick,->] ([yshift=-1pt] 0, -10) -- ([yshift=10pt] 0, 40);

        \draw[Firebrick1!80,thick] ([shift={(10pt,10pt)}] 0,40) -- ++(5mm,0) node[right] {\color{black} $y = p(x)$};
        \draw[SteelBlue1,thick,dashed] ([shift={(10pt,0pt)}] 0,40) -- ++(5mm,0) node[right] {\color{black} $y = p'(x)/3$};

        \draw[Firebrick1!80,thick,range=-10:40,samples=150]
            plot[prefix=tikzGnuPlot/,id=chapter_\thechapter_AnalysisOfBiquadraticPolynomial] function{1.*x**4-13.*x**2+36.};
        \draw[SteelBlue1,thick,range=-10:40,samples=100,dashed]
            plot[prefix=tikzGnuPlot/,id=chapter_\thechapter_AnalysisOfBiquadraticPolynomialDerivative1] function{(4.*x**3-26.*x)/3.};

        \foreach \i in {-4,-2,...,4} \draw (\i,3pt) -- (\i,-3pt)
            node[below,inner sep=2,fill=white,fill opacity=.8,text opacity=1] {\scriptsize$\i$};
        \foreach \i in {-4,-3,...,4} \draw (\i,2pt) -- (\i,-2pt);
        \foreach \i in {-10,0,...,40} \draw (3pt,\i) -- (-3pt,\i)
            node[left,inner sep=2,fill=white,fill opacity=.8,text opacity=1] {\scriptsize$\i$};
        \foreach \i in {-5,5,...,35} \draw (-2pt,\i) -- (2pt,\i);
        \draw node[above left] at (-1.47196,12.5278) {$W_1$}
            node[above right] at (1.47196,12.5278) {$W_2$};
        \filldraw (-1.47196,12.5278) circle(1pt) (1.47196,12.5278) circle(1pt);
    \end{tikzpicture}
\end{document}

grafik

leanhdung1994 commented 1 week ago

@leanhdung1994 can you show in a video editing this picture?

% pdflatex
\documentclass[10pt,a5paper]{report}
\usepackage[x11names,table]{xcolor}
\usepackage{tikz}
\usetikzlibrary{math,calc,arrows.meta}
\pagestyle{empty}
\begin{document}
    \begin{tikzpicture}[domain=-4:4,>=Latex,x=10.mm,y=1.mm,thick]\scriptsize
        \draw[semithick,->] ([xshift=-10pt]-4, 0) -- ([xshift=10pt] 4, 0) node[right] {$x$};
        \draw[semithick,->] ([yshift=-1pt] 0, -10) -- ([yshift=10pt] 0, 40);

        \draw[Firebrick1!80,thick] ([shift={(10pt,10pt)}] 0,40) -- ++(5mm,0) node[right] {\color{black} $y = p(x)$};
        \draw[SteelBlue1,thick,dashed] ([shift={(10pt,0pt)}] 0,40) -- ++(5mm,0) node[right] {\color{black} $y = p'(x)/3$};

        \draw[Firebrick1!80,thick,range=-10:40,samples=150]
            plot[prefix=tikzGnuPlot/,id=chapter_\thechapter_AnalysisOfBiquadraticPolynomial] function{1.*x**4-13.*x**2+36.};
        \draw[SteelBlue1,thick,range=-10:40,samples=100,dashed]
            plot[prefix=tikzGnuPlot/,id=chapter_\thechapter_AnalysisOfBiquadraticPolynomialDerivative1] function{(4.*x**3-26.*x)/3.};

        \foreach \i in {-4,-2,...,4} \draw (\i,3pt) -- (\i,-3pt)
            node[below,inner sep=2,fill=white,fill opacity=.8,text opacity=1] {\scriptsize$\i$};
        \foreach \i in {-4,-3,...,4} \draw (\i,2pt) -- (\i,-2pt);
        \foreach \i in {-10,0,...,40} \draw (3pt,\i) -- (-3pt,\i)
            node[left,inner sep=2,fill=white,fill opacity=.8,text opacity=1] {\scriptsize$\i$};
        \foreach \i in {-5,5,...,35} \draw (-2pt,\i) -- (2pt,\i);
        \draw node[above left] at (-1.47196,12.5278) {$W_1$}
            node[above right] at (1.47196,12.5278) {$W_2$};
        \filldraw (-1.47196,12.5278) circle(1pt) (1.47196,12.5278) circle(1pt);
    \end{tikzpicture}
\end{document}

grafik

I have run your code on Overleaf but an error happens:

image

Could you give me a new code sample?

octaeder commented 1 week ago

I wonder why you can't write those files. Please try by removing the prefix option (prefix=tikzGnuplot/) in both cases. You may also shorten the value of the id option up to and including the underscore before AnalysisOf....

leanhdung1994 commented 1 week ago

I wonder why you can't write those files. Please try by removing the prefix option (prefix=tikzGnuplot/) in both cases. You may also shorten the value of the id option up to and including the underscore before AnalysisOf....

I use TeXpresso to edit

\documentclass[10pt,a5paper]{report}
\usepackage[x11names,table]{xcolor}
\usepackage{tikz}
\usetikzlibrary{math,calc,arrows.meta}
\pagestyle{empty}
\begin{document}
    \begin{tikzpicture}[domain=-4:4,>=Latex,x=10.mm,y=1.mm,thick]\scriptsize
        \draw[semithick,->] ([xshift=-10pt]-4, 0) -- ([xshift=10pt] 4, 0) node[right] {$x$};
        \draw[semithick,->] ([yshift=-1pt] 0, -10) -- ([yshift=10pt] 0, 40);

        \draw[Firebrick1!80,thick] ([shift={(10pt,10pt)}] 0,40) -- ++(5mm,0) node[right] {\color{black} $y = p(x)$};
        \draw[SteelBlue1,thick,dashed] ([shift={(10pt,0pt)}] 0,40) -- ++(5mm,0) node[right] {\color{black} $y = p'(x)/3$};

        \begin{scope}
            \clip (-4,-10) rectangle (4,40);
            \draw[Firebrick1!80,thick,range=-10:40,samples=150] plot[prefix=tikzGnuPlot] (\x,{1*(\x)^4 - 13*(\x)^2 + 36});
            \draw[SteelBlue1,thick,range=-10:40,samples=100,dashed] plot[prefix=tikzGnuPlot] (\x,{(4*\x^3-26*\x)/3});
        \end{scope}

        \foreach \i in {-4,-2,...,4} \draw (\i,3pt) -- (\i,-3pt)
        node[below,inner sep=2,fill=white,fill opacity=.8,text opacity=1] {\scriptsize$\i$};
        \foreach \i in {-4,-3,...,4} \draw (\i,2pt) -- (\i,-2pt);
        \foreach \i in {-10,0,...,40} \draw (3pt,\i) -- (-3pt,\i)
        node[left,inner sep=2,fill=white,fill opacity=.8,text opacity=1] {\scriptsize$\i$};
        \foreach \i in {-5,5,...,35} \draw (-2pt,\i) -- (2pt,\i);
        \draw node[above left] at (-1.47196,12.5278) {$W_1$}
        node[above right] at (1.47196,12.5278) {$W_2$};
        \filldraw (-1.47196,12.5278) circle(1pt) (1.47196,12.5278) circle(1pt);
    \end{tikzpicture}
\end{document}

Here is my recording

IMAGE ALT TEXT HERE

Above, I use TeXpresso in WSL2-ubuntu on a Windows laptop, so the performance of TeXpresso would be much better if I use TeXpresso on a Linux laptop.

octaeder commented 1 week ago

Still surprising, thanks. I remember that wysiwig latex was already possible on OS/2 in mid 90s.