 diffany-admin
commented
9 years ago
diffany-admin
commented
9 years ago ![]() Comment by svlandeg
Tue May 20 13:40:22 2014
Comment by svlandeg
Tue May 20 13:40:22 2014
Example from part of the 1.5h osmotic data, with node fill color and node label color either purple or white:

Closed diffany-admin closed 9 years ago
diffany-admin
commented
9 years ago ![]() Comment by svlandeg
Tue May 20 13:40:22 2014
Comment by svlandeg
Tue May 20 13:40:22 2014
Example from part of the 1.5h osmotic data, with node fill color and node label color either purple or white:
diffany-admin
commented
9 years ago ![]() Comment by svlandeg
Tue May 20 13:52:58 2014
Comment by svlandeg
Tue May 20 13:52:58 2014
PS: I really like not having lines around the nodes. Also helps with these long node names when a shorter synonym is not available...
diffany-admin
commented
9 years ago ![]() Comment by svlandeg
Thu Jun 12 15:22:01 2014
Comment by svlandeg
Thu Jun 12 15:22:01 2014
Example of alternative visualisation, with #145. Now the up/down regulation is depicted as node attributes rather than edges with hidden nodes.
diffany-admin
commented
9 years ago ![]() Comment by svlandeg
Wed Jun 18 20:45:31 2014
Comment by svlandeg
Wed Jun 18 20:45:31 2014
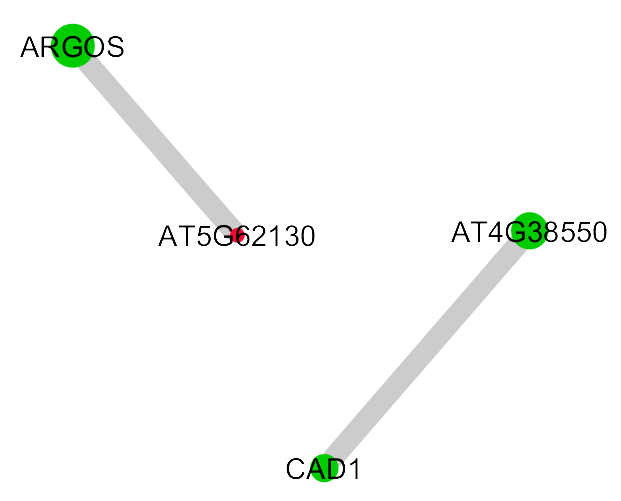
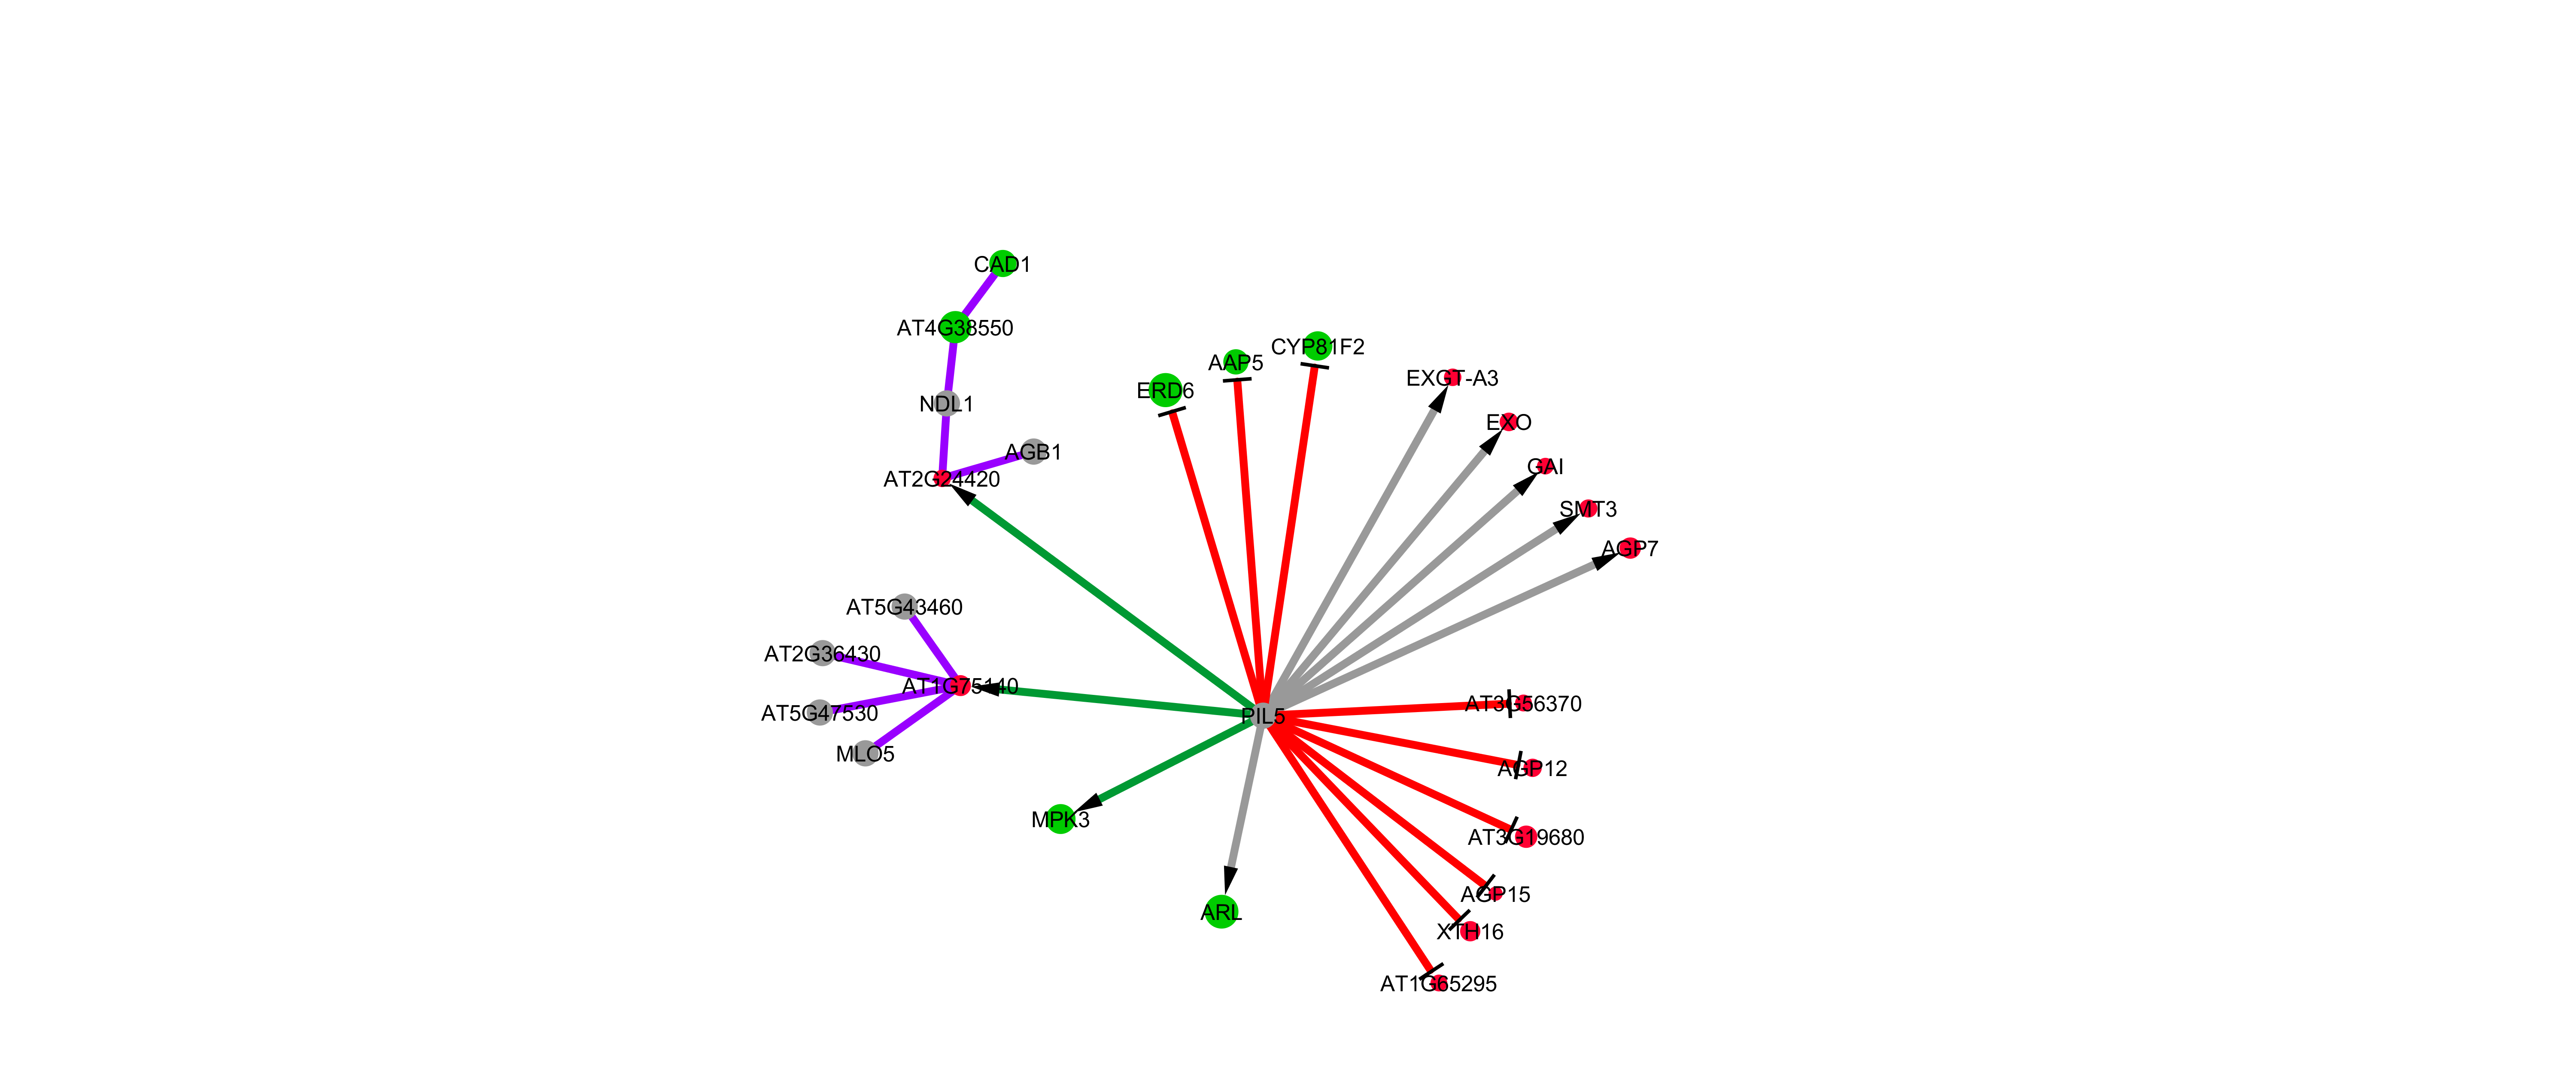
Another example, with positive (green edge) and negative (red edge) regulations & PPIs (purple), and non-DE genes (grey) as well as overexpressed (green node) as repressed (red node) genes:
diffany-admin
commented
9 years ago ![]() Comment by svlandeg
Thu Jun 19 13:31:27 2014
Comment by svlandeg
Thu Jun 19 13:31:27 2014
This might give some additional trouble in Cytoscape, as node attributes are defined per network collection. So, Diffany would need to be able to calculate differential networks across different collections...
diffany-admin
commented
9 years ago ![]() Comment by svlandeg
Thu Jun 19 15:19:24 2014
Comment by svlandeg
Thu Jun 19 15:19:24 2014
A final option is to have a pre-processing step which translates the DE genes and their FC to a difference in weight of the adjacent edges... will discuss these options with Marieke and see whether she has an opinion...
diffany-admin
commented
9 years ago ![]() Comment by svlandeg
Thu Aug 28 15:13:00 2014
Comment by svlandeg
Thu Aug 28 15:13:00 2014
They think the translation of this node-specific data to the edge weights might make for more intuitive, condensed networks. This will avoid the collection-specific node attribute problem in cytoscape, though at the same time we will lose some information. But I guess the user will then have to consult the raw data to fetch the FC values etc.
diffany-admin
commented
9 years ago ![]() Comment by svlandeg
Fri Sep 5 08:41:32 2014
Comment by svlandeg
Fri Sep 5 08:41:32 2014
This will be further implemented in #184
Provide Cytoscape visualisation of the data modeled in #131