 yutannihilation
commented
5 years ago
yutannihilation
commented
5 years ago @yutannihilation figured out this is caused by
(I talked with atusy outside of GitHub) Sorry, probably my explanation was not exact; you don't need expand argument because the colour scale is not expanded. The ticks are shifted by 0.5 because these are the places they should be as the gradient by grid::rasterGrob() is interpolated between the middles of the tiles, not between the edges of the tiles. For example, you can see the gradation happens only between the center of the black and the center of the pink:
library(grid)

g <- matrix(hcl(0, 100, c(0, 100)),
            nrow=2, ncol=1)
# interpolated
grid.newpage()
grid.raster(g, x = 0.25, width = 0.5, height = 1)
grid.raster(g, x = 0.75, width = 0.5, height = 1, interpolate = FALSE)
Created on 2019-08-30 by the reprex package (v0.3.0)
So, the short answer would be "you don't need expand, the colorbar shows the exact range of the values," but I agree this might be a bit confusing to see the bar runs over the ticks...
@thomasp85 @clauswilke
Do you know there's some tricks to chop a rasterGrob at the very start and end of the gradient? Can we use clipGrob?
 clauswilke

 hadley
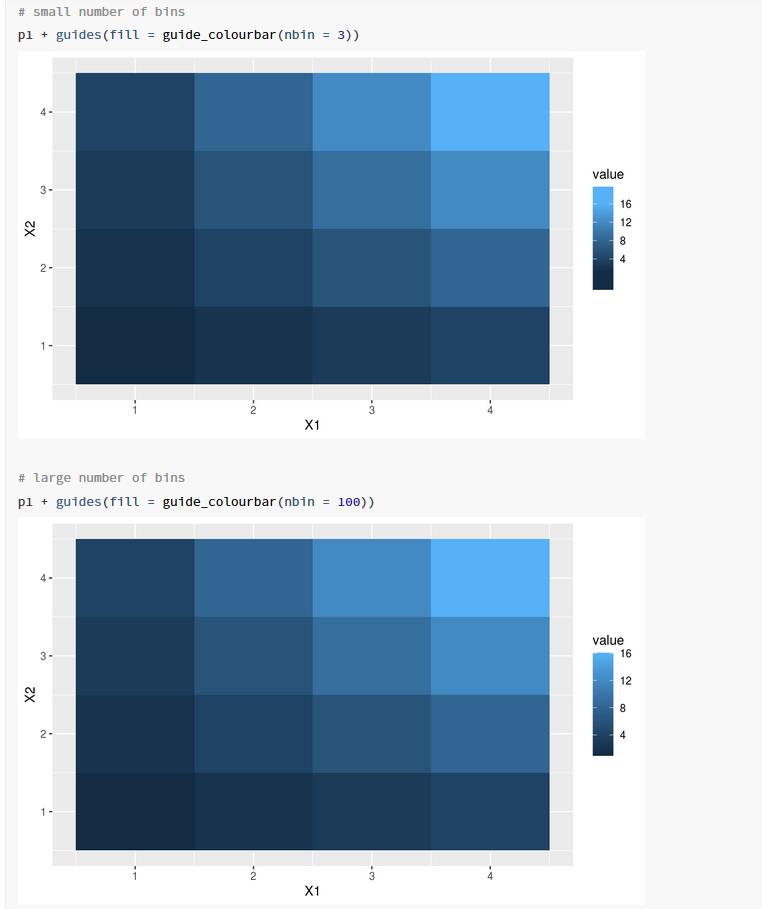
 lock[bot]
Unlike scales for continuous x or y (e.g.,
scale_x_continuous), those for color or fill (e.g.,scale_color_gradient) is not supportingexpandoption. At least, I wantexpand = c(0, 0)to work so that color bars exactly represents the range of color or fill mappings.The example below shows that range of color bar is wider than the range specified in
limitsargument even ifexpand = c(0, 0)is specified.@yutannihilation figured out this is caused by https://github.com/tidyverse/ggplot2/blob/047b528c98a5852d058d77c5e188c9637c88c7f0/R/guide-colorbar.r#L336
Created on 2019-08-29 by the reprex package (v0.3.0)