 thomasp85
commented
1 year ago
thomasp85
commented
1 year ago This is due to a switch to the ragg device in 3.3.6
The first "issue" is due to the default png() device not applying anti-aliasing to fill whereas ragg does. The reason why I put issue in quotation marks is that the difference is only noticeable when zoomed into pixel level magnification and also because the behaviour of png() is not more correct since it will give higher visual weight to points depending on where on the pixel grid they are placed.
The last issue was due to a text rendering bug in ragg on certain linux systems that should have been fixed in the latest release
 rikudoukarthik
The problem
I have some code that creates a map with numerous points, annotated with some stats, on a monthly basis. This worked fine until I updated
ggplotto3.3.6, after which the plots have broken and I've not been able to figure out the solution. As far as I can tell, the issue lies in theggsave()call, but I don't know what has changed and how to fix it.There are two main issues that have come up. But to illustrate, I will attach below comparison images of the "good" and "bad" versions (click links to see full-size).
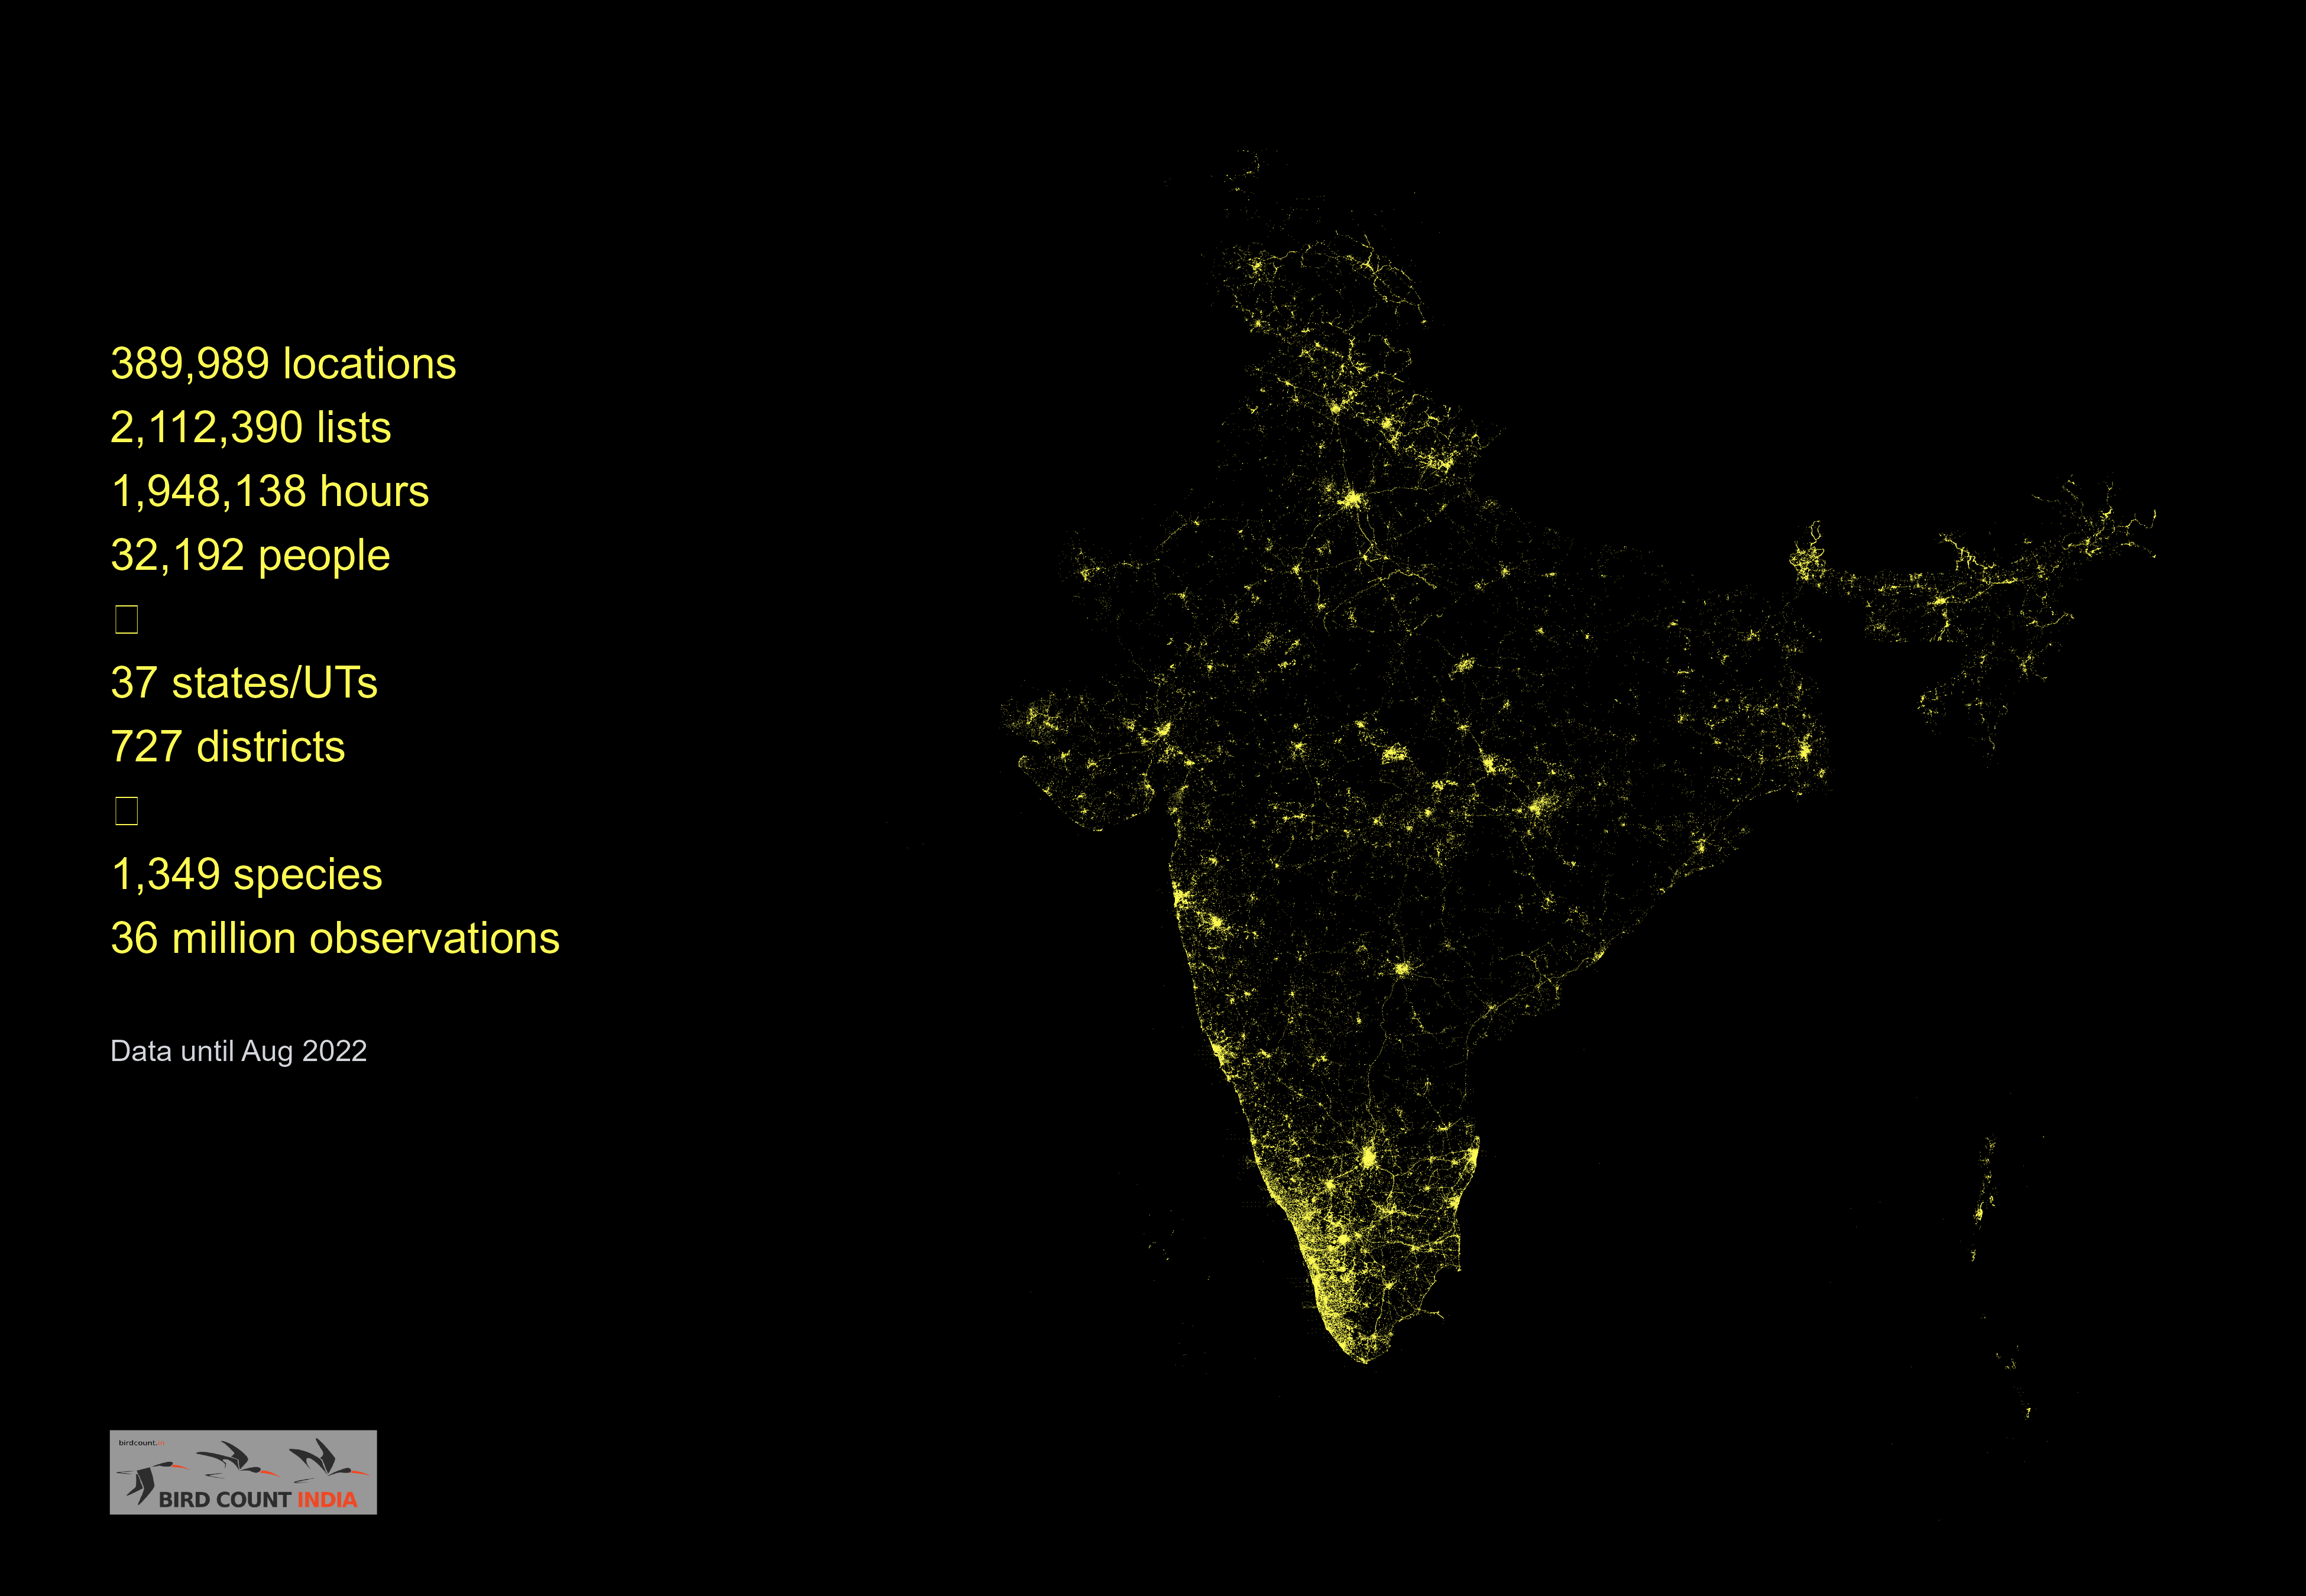
Good points
Bad points
The good version has uniformly coloured points/squares while the latter has strange points coloured irregularly.
Good text
Bad text
The non-breaking space is formatted properly in the good version, while it appears as a box in the bad version.
Debugging attempts
One potential cause I noted for the irregular points was some updates in the works for the "size" parameter (see this blog post). Such things have happened in the past as well (see this for example). However, this update is claimed to be for the next release, and moreover like I said, I have a hunch the issue I'm facing has something to do with
ggsave(). And regardless, I already tried tweaking the size and stroke of thegeom_point()but haven't been able to recover the old version properly.The RStudio plot device doesn't indicate any issue with the points, and using the
png()method instead ofggsave()to write produces the correct/"good" version.I tried reverting to
ggplot 3.3.5but this did not fix the issue. Moreover, two others tried the same code on their separate systems, both withggplot 3.3.6, but only one replicated my issue while the other produced the good version. Nevertheless, the code was certainly working fine until July, only after which I updated several packages and the code broke.For the record, I have ensured that the issue is not with the data. So, although I have used data until June to illustrate the good version, that same dataset generates the bad maps when the code is run now (i.e., after the updates).
I am hoping someone with a better understanding of the package and the update will be able to figure out what exactly the breaking change was!
Other links
4824
Reprex
There are two files required for the reprex below to work:
.RDatafile with the necessary data objects (link)