 timbod7
commented
9 years ago
timbod7
commented
9 years ago That should be possible. What is the type of your x axis? Can you post your example code? On 23 Jan 2015 06:43, "Mitchell Rosen" notifications@github.com wrote:
I'm struggling to put together a graph like this one: http://mathbench.umd.edu/modules/prob-stat_bargraph/graphics-final/graph-male-female.jpg
Is this possible with the current API? I don't think there's any way to "hook" into a PlotBars render to capture the correct x-axis values to feed into a PlotErrBars.
— Reply to this email directly or view it on GitHub https://github.com/timbod7/haskell-chart/issues/70.
 mitchellwrosen

 PeteRegan
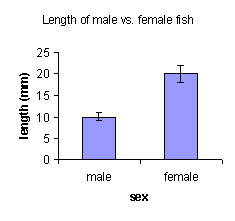
I'm struggling to put together a graph like this one: http://mathbench.umd.edu/modules/prob-stat_bargraph/graphics-final/graph-male-female.jpg
Is this possible with the current API? I don't think there's any way to "hook" into a PlotBars render to capture the correct x-axis values to feed into a PlotErrBars.