 timja
commented
7 years ago
timja
commented
7 years ago kboz:
We have a single (master) Windows Jenkins node with 4 executors, no slaves. Running Jenkins v2.48
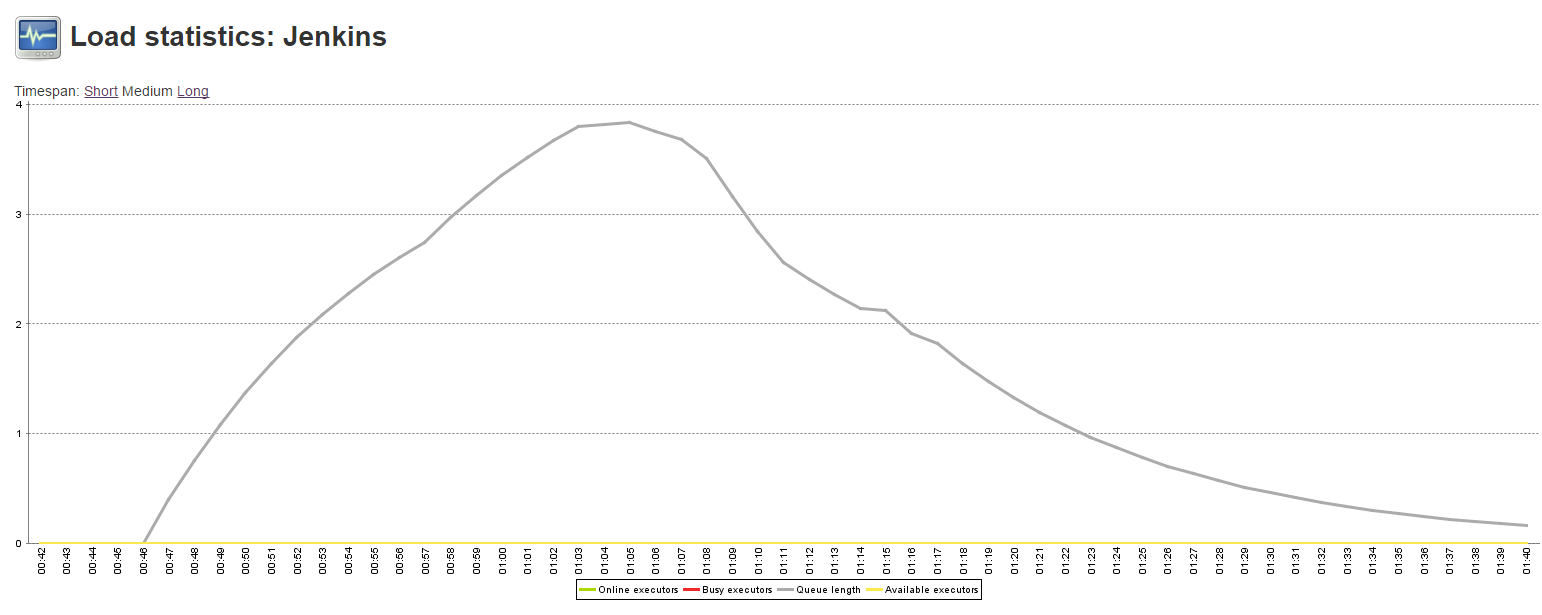
Viewing the load statistics for the entire system (http://jenkins/load-statistics ) only displays queue length, with zero executors (online, busy or available)
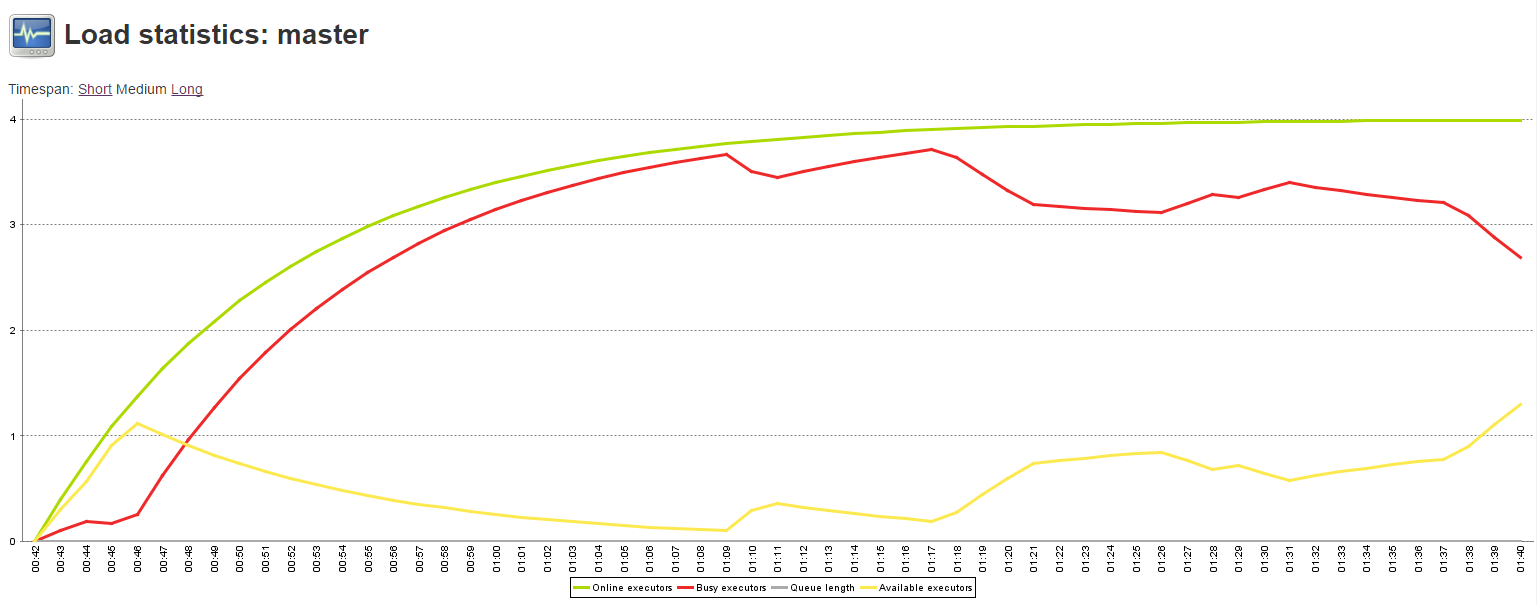
Viewing the load statistics just for the master node (http://jenkins/computer/(master)/load-statistics ) over the same period, displays the executors, but zero queue length.
Surely these two graphs should look the same, and both include all 4 metrics?
I just set up a new Jenkins and was checking out how the load was during our nightly builds, when I noticed that the graph is missing 2 executors. Playing with shutting down the slaves it appears to be the executors on the master that are not included in the graph.
I am showing the graph for the whole installation, not for any specific node. I must say that checking the graph for the master only actually does show 2 executors!
Please check the attached screenshots. On the screenshot with the running project, you can actually see the graph is going down – this also made me think that Jenkins is not calculating the master executors.
Originally reported by malice, imported from: Load statistics graph don't show the correct number of executors