 CedNaru
commented
3 years ago
CedNaru
commented
3 years ago With the current way Godot objects are made on the JVM side, I don't think we can make the escape analysis to work because creating a weak reference already counts as escaping (Hard to find info about that but the only thing we do with the object is to create a weakReference to it in the constructor).
Concerning the rate of our GCThread, I think we can use ReferenceQueue. https://docs.oracle.com/javase/8/docs/api/java/lang/ref/ReferenceQueue.html
When we create a weak reference, we can register a ReferenceQueue with it. Every time the JVM GC detects that he can delete an object tied to a referenceQueue, it's going to be added to it BEFORE being deleted for good. So instead of checking our entire HashMap every iteration, we can just check if ReferenceQueue is empty or not. If not empty, it means the GC ran and decided to delete Objects. Because they are not deleted yet, we can retrieve the C++ pointer from them.
In the end, we are going to keep having the thread wait X ms, but instead of checking weakReferences one by one, we just check if ReferenceQueue is empty, which is a lot cheaper to do. For each element in the ReferenceQueue, we can add the pointer to the shared buffer and call C++ only once, as long as the number of pointers is not bigger than the maximum size of the buffer, it shouldn't be an issue.
The problem
Currently we're having some severe frame drops in certain cases from time to time. The issue can be observed in the
BunnymarkV2benchmark.On my machine (Intel(R) Xeon(R) CPU E5-2630 v4 @ 2.20GHz, AMD Radeon RX 5700 XT, 64GB DDR4 @ 2133 MT/s) the framedrops happen each ~2sec. At an average frametime of 16ms and a dropped frametime of ~70ms.
Normal frametime after the benchmark settles at ~60FPS: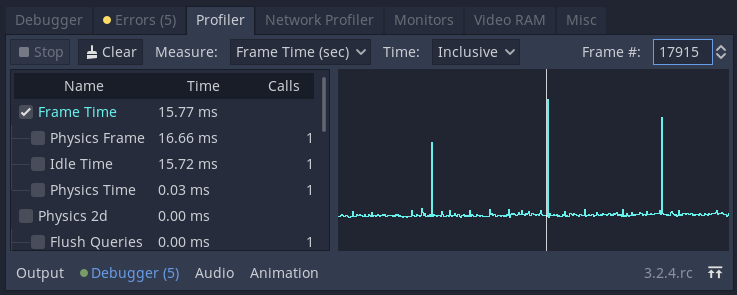
Increased frametime for one frame each ~2sec: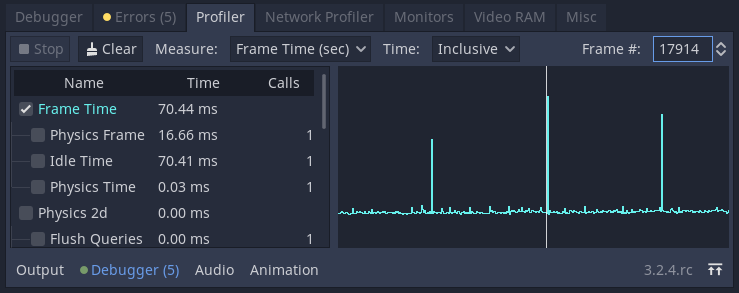
This microstuttering is noticeable by eye.
The Source
The reason for this is the way our GC is implemented currently and how it works together with the JVM GC.
In the
V2benchmark a newVariantArrayis created each frame (inside_processwithget_children). Our own GC runs each 500ms. But this does not mean that the JVM GC runs this often. So we pile up hundrets ofVariantArray's and our GC will not clean them as theWeakReferencefor them is not null, as the JVM GC has not run yet. But once the JVM GC kicks in and deletes them, all of a sudden our GC has to get rid of hundrets ofVariantArray's at once, causing a one frame hickup.We can verify this by forcing the JVM GC to run together with our own GC. If I do this I have a smaller hickup each 500ms (the interval at which the GC's then do their work) instead of a bigger hickup each ~2s.
The following timeline from hotspot shows this nicely:
Without forced JVM GC -> hickup each ~2s:
With forced JVM GC -> smaller hickup each 500ms:
And if we look at the flamegraph we see that the cause is the deletion of the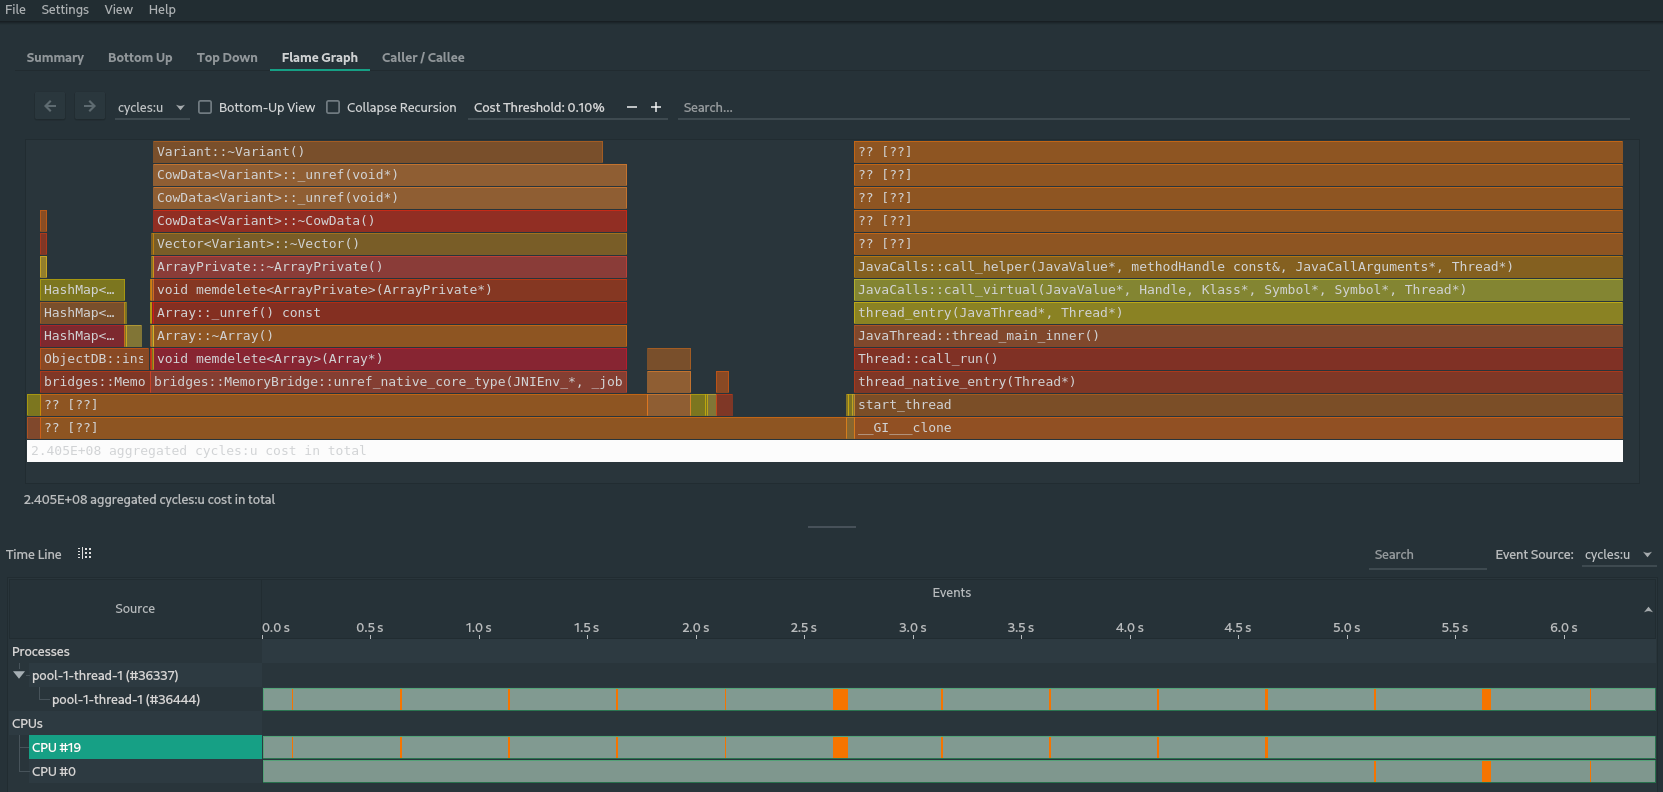
VariantArray's:The reason why this only showed up on my machine in this scale and not so much on other machine's (including my laptop) is most likely because of the amount of RAM in the system and the amount i reserve for each JVM process by default (64GB and 6GB respectively) and thus the JVM GC runs less often, hence piling up more
VariantArray's to clean up once the JVM GC has done it's work.Needed fixes
So one thing that we need to look at is what breaks the escape analysis. Because the
VariantArray's are created in the function local scope and thus should be allocated on the stack and thus no GarbageCollection should be necessary. Probably because we register a WeakRef to the VariantArrays in our GC is enough to break the escape analysis and thus the VariantArrays are actually allocated on the heap rather than on the stack. We should investigate this and maybe find a solution for it.A second problem is that we call CPP code from jvm for each object that needs to be deleted rather than batching all rawPointers into one call. Which creates unnecessary pressure on the JVM/CPP interop.
Lastly we should find a good rule on when to start the call to delete those objects so we mitigate the problem of locking the main thread up from our GC thread, and not just blindly run our GC at an fixed interval.
Additional Data
No forced JVM GC ptrace -> hickup ~2s: perf.data.zip Forced JVM GC ptrace -> hickup 500ms: perf.data_1.zip