 kanitw
commented
8 years ago
kanitw
commented
8 years ago We might not need to extend Vega for this.
Keep in mind that Vega-Lite is a visualization grammar, we can't add pie support without considering its implication for the underlying coordinate system and other visualizations that could be coherently expressed within the grammar .
We have not spent much time on because pie chart and other polar coordinate based charts generally leads to perceptual issues. In fact, visualization experts generally favor 1D-stacked bar chart to pie charts. So while they might be useful in some cases, we plan to work on other more important features first.
 jsonbecker
 mredaelli
 domoritz
 king612
 jwoLondon
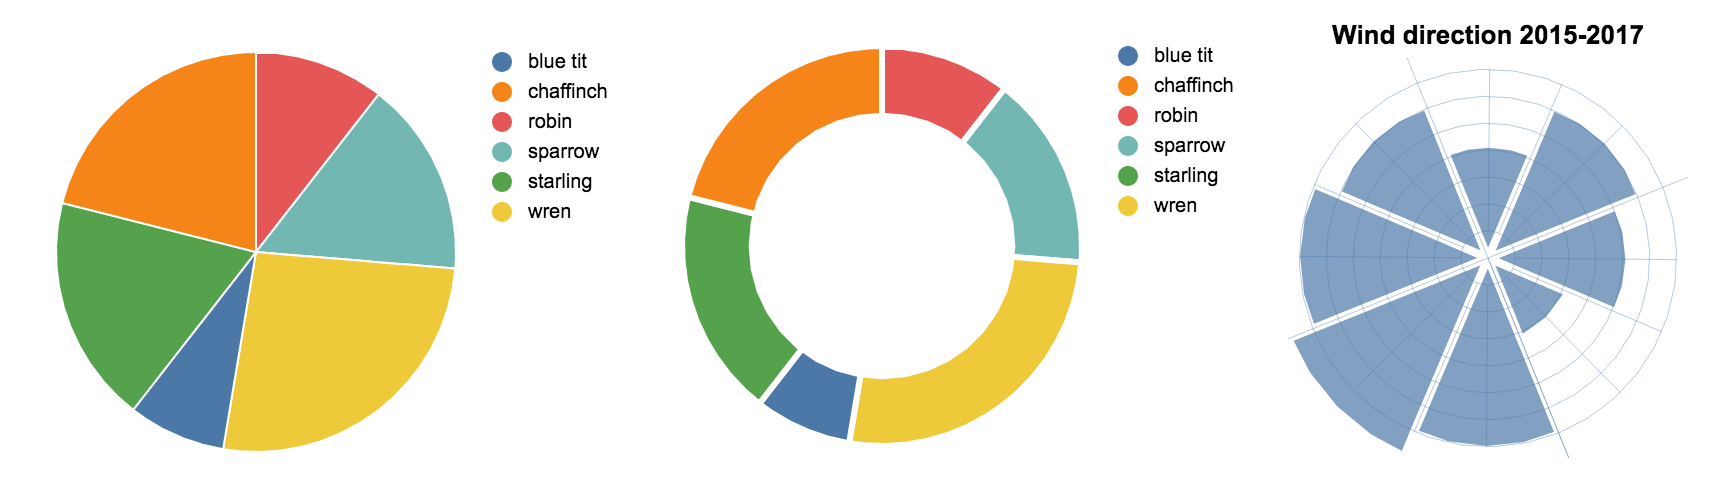


 jakevdp
 nyurik
 aishfenton
 g3o2
g3o2 summerswallow-whi
 lelandwilkinson


 ebocher
Is full polar coordinate support required for pie charts? It seems like we could just generate a vega pie transform with the startAngle/endAngle mapped to the color channel.