Open vspathonis opened 1 year ago
I think the latency comes from cold starts. Cloud Run is a serverless docker platform, so when your app receive little traffic it get shut down, the first request will wake the docker instance but it can take a little time before your app start (node has to start, then your nextjs server has to start), every subsequent requests that comes between the amount of time your app has to stay alive is faster since everything is already started.
So it's normal than when there is little to no traffic, the app start slow. In a local docker workstation it is normal since i suppose you don't have cold starts.
I think you can specify in Cloud Run a minimum amount docker instances to run when there is no traffic so that there is at least one running instance of your app when testing.
Hi, I work with @vspathonis on the issue. Our deployment has a minimum of 50 Cloud Run instances waiting for traffic and also we have disabled CPU throttling, which allocates CPU during the whole lifetime of the container instance. We have been in communication with Google support and they have pointed out that code execution is at fault instead of their infrastructure. From our testing, it seems that the problem only surfaces when the Docker image is launched via Cloud Run and is NEVER reproduced in a local workstation or other types of Cloud virtual machines.
What we would like is get advise on how to debug the issue in order to pinpoint the root cause, as we cannot get more information from Google which is our production deployment environment.
To help even further, it seems that our landing page consumes 30+ seconds to redirect to the login page and another 30+ seconds to load the login page. Our corresponding back-end service (login/logout, data fetch, data push) is responding within milliseconds for most requests and our monitoring logs showcase up to 3 seconds of response time for the most processing heavy API endpoints. So the API back-end is not responsible for the delays. It seems that delays are coming mostly from the API Route processing, which mostly acts as a proxy to perform the back-end requests and save sensitive account data to the Iron Session encrypted cookie and/or return fetched JSON data to the UI. I am starting to suspect the delays are caused by the API Route processing (not UI) getting very low CPU resources even though the Cloud Run instance is already up and running and can handle the serving of static resources. Iron session cookies involve encryption and decryption of session cookie data so getting low CPU resources during this process may explain the phenomenon. We just need good direction on how to debug and profile the performance of the Next application.
I'm gonna sound stupid but what about console.log
or console.time
(& console.timeEnd
) to validate your hypothesis ?
Since the issue only happens on GCP it is kinda hard to help you debug because not everyone can easily deploy to GCP.
Thanks for the advise. We have added some extra logs in our application and it seems that we get a 40 seconds delay between the initialization of the node server (CMD ["node", "server.js"]
) in the container startup and the first call of Server Side Rendering (getServerSideProps
of of index.tsx). See the attached screenshot from the Google Cloud logs.
It does not seem I can attach it directly, give me some moments to upload it to a network share.
Console logging messages taken from Google Cloud Run logs here.
From what we can see here the server starts at 21:43:47.957 (message Listening on port 3000
) and the getServerSideProps
function called withSessionSSR
is getting called from the index page at 21:44:27.202, which is nearly 40 seconds later. How can we find out what is going on between the node server being ready on port 3000 and the index page getServerSideProps
?
Here is some snippets of our code to help you understand the workflow (I cannot disclose whole files due to company policy):
ironsession.ts
...
// Iron Session for cookie encryption https://github.com/vvo/iron-session
import type { IronSessionOptions } from "iron-session"
import { withIronSessionApiRoute, withIronSessionSsr } from "iron-session/next"
...
// Wrapper for applying Iron Session options in Server Side Rendering pages
export function withSessionSSR<P extends { [key: string]: unknown }>(
handler: (
context: GetServerSidePropsContext,
) => GetServerSidePropsResult<P> | Promise<GetServerSidePropsResult<P>>,
) {
// eslint-disable-next-line no-console
console.log(
"[IRON SESSION] - withSessionSSR function triggered - TIME: ",
new Date(),
)
return withIronSessionSsr(handler, ironSessionOptions)
}
...
index.tsx
...
import { withSessionSSR } from "../lib/ironsession"
...
const getServerSideProps: GetServerSideProps = withSessionSSR<IndexProps>(
async ({
req,
}): Promise<
| {
props: IndexProps
}
| Redirectable
> => {
// eslint-disable-next-line no-console
console.log("[INDEX] - Init server side - TIME: ", new Date())
// Gets logged in user information from iron session here
// ...
if (!logged_in) {
return {
redirect: {
permanent: false,
destination: "/login",
},
}
}
return {
redirect: {
permanent: true,
destination: "/landing_page",
},
}
},
)
export { getServerSideProps }
Running the same Docker image via Docker compose locally on my workstation showcases the following:
2023-04-19T08:49:48.111582942Z info - Loaded env from /app/.env
2023-04-19T08:49:48.177201634Z Listening on port 3000
2023-04-19T08:49:52.657577486Z [IRON SESSION] - withSessionSSR function triggered - TIME: 2023-04-19T08:49:52.656Z
2023-04-19T08:49:52.663600095Z [INDEX] - Init server side - TIME: 2023-04-19T08:49:52.663Z
2023-04-19T08:49:52.683672238Z [INDEX] - Init server side - TIME: 2023-04-19T08:49:52.683Z
We see a 4 second delay between the messages Listening on port 3000
and [IRON SESSION] ...
which is 10 times less than what is showcased in Google Cloud but still I think is way too much for an application startup. How can we find out and profile what is going on between the node server readiness and the Next SSR function?
I have created a small curl script to measure website response latency and look what is the behavior of the local container after startup:
Testing Website Response Time for :http://127.0.0.1:3000/
Lookup Time: 0.000021
Connect Time: 0.000096
AppCon Time: 0.000000
Redirect Time: 0.000000
Pre-transfer Time: 0.000116
Start-transfer Time: 5.105965
Total Time: 5.106050
Testing Website Response Time for :http://127.0.0.1:3000/
Lookup Time: 0.000032
Connect Time: 0.000134
AppCon Time: 0.000000
Redirect Time: 0.000000
Pre-transfer Time: 0.000167
Start-transfer Time: 0.008889
Total Time: 0.008973
Testing Website Response Time for :http://127.0.0.1:3000/
Lookup Time: 0.000031
Connect Time: 0.000133
AppCon Time: 0.000000
Redirect Time: 0.000000
Pre-transfer Time: 0.000163
Start-transfer Time: 0.002368
Total Time: 0.002498
Testing Website Response Time for :http://127.0.0.1:3000/
Lookup Time: 0.000032
Connect Time: 0.000138
AppCon Time: 0.000000
Redirect Time: 0.000000
Pre-transfer Time: 0.000172
Start-transfer Time: 0.002188
Total Time: 0.002249
Testing Website Response Time for :http://127.0.0.1:3000/
Lookup Time: 0.000032
Connect Time: 0.000117
AppCon Time: 0.000000
Redirect Time: 0.000000
Pre-transfer Time: 0.000150
Start-transfer Time: 0.002379
Total Time: 0.002438
The first call always lasts more than 5 seconds and then the consequent ones are in milliseconds. What this showcases is that initial request will always have much larger delay in response than any other call even on localhost. This seems to be scaled up when run in the Cloud Run containers in both delay (10x times more in some cases) and in frequency (the container seems to run node server startup every time the traffic is increased).
UPDATE: We have raised the issue on Google Cloud support and it is escalated. I will notify on the conclusion.
The current status is the following:
node server.js
and executing the application Typescript code first line is the culprit of the majority of the total delay. I have tried to create a minimal Next app without any extra resources (image, css, etc) and can still take up to 2 seconds between the node server launch and taking control of the execution in Typescript.Any advise on how to bring down the delay between launching the Docker container and running the application code is highly appreciated. It is a black box for us.
I am astonished by how a simple and small in scope application can be so slow under cloud environments. :(
@MiltiadisKoutsokeras can you share the repo (or the code) for your minimal reproduction with the corresponding Dockerfile ?
I want to test on my end.
@Fredkiss3 I will post it here next week as I am on the road now. Thank you.
@Fredkiss3 Here is the minimal project to reproduce the problem: https://github.com/MiltiadisKoutsokeras/nextjs_issue_48539
You can check the test application deployed in Google Cloud Run here.
Hi, any updates on an issue?
Hi, unfortunately there is no update on the issue at this time.
The problem still persists.
For all interested parties, we had to migrate the Next.js application out of Google Cloud Run instances as a temporary measure.
One mitigation proposed by Google engineers is to migrate all application static content (Javascript, images, CSS) to a content delivery service to avoid serving them from the Next.js server. I do not know how this could help our use case, as the content is minimal compared to other media rich applications.
Do you using https://firebase.google.com/docs/hosting/frameworks/nextjs? @MiltiadisKoutsokeras, where your mitigation plan?
Even if the Cloud Run instance is configured to be always on (i.e. CPU is always allocated and minimum number of instances > 1) the response time is slow... https://ray.run/ is averaging 2 seconds to produce a response.
For what it is worth, I found that using large memory instances helps to improve boot time.
After going from 1GB to 8GB, the start time reduced from 2 seconds to ~500 ms.
After a ton of debugging, it turned out to be a disk IO heavy operation at the start of the service.
*interesting
After a ton of debugging, it turned out to be a disk IO heavy operation at the start of the service.
Please explain... Does next do a disk operation at the start of server ? (Like creating files or something like that ?)
After a ton of debugging, it turned out to be a disk IO heavy operation at the start of the service.
Please explain... Does next do a disk operation at the start of server ? (Like creating files or something like that ?)
It was specific to my website because all my blog entries are in markdown that needs to be read and parsed.
Do you using https://firebase.google.com/docs/hosting/frameworks/nextjs? @MiltiadisKoutsokeras, where your mitigation plan?
I am very sorry for missing your question. We mitigated the issue by hosting the application on a Container running on a Cloud Virtual Machine behind a reverse proxy. We run multiple instances and the delay is paid once on first startup and never on end-user's first visit. We will eventually migrate everything to a Kubernetes cluster which will hopefully showcase the same behavior as the Virtual Machine. In Serverless environments the delay is paid on every new instance start and is also exaggerated when the start is from a cold container.
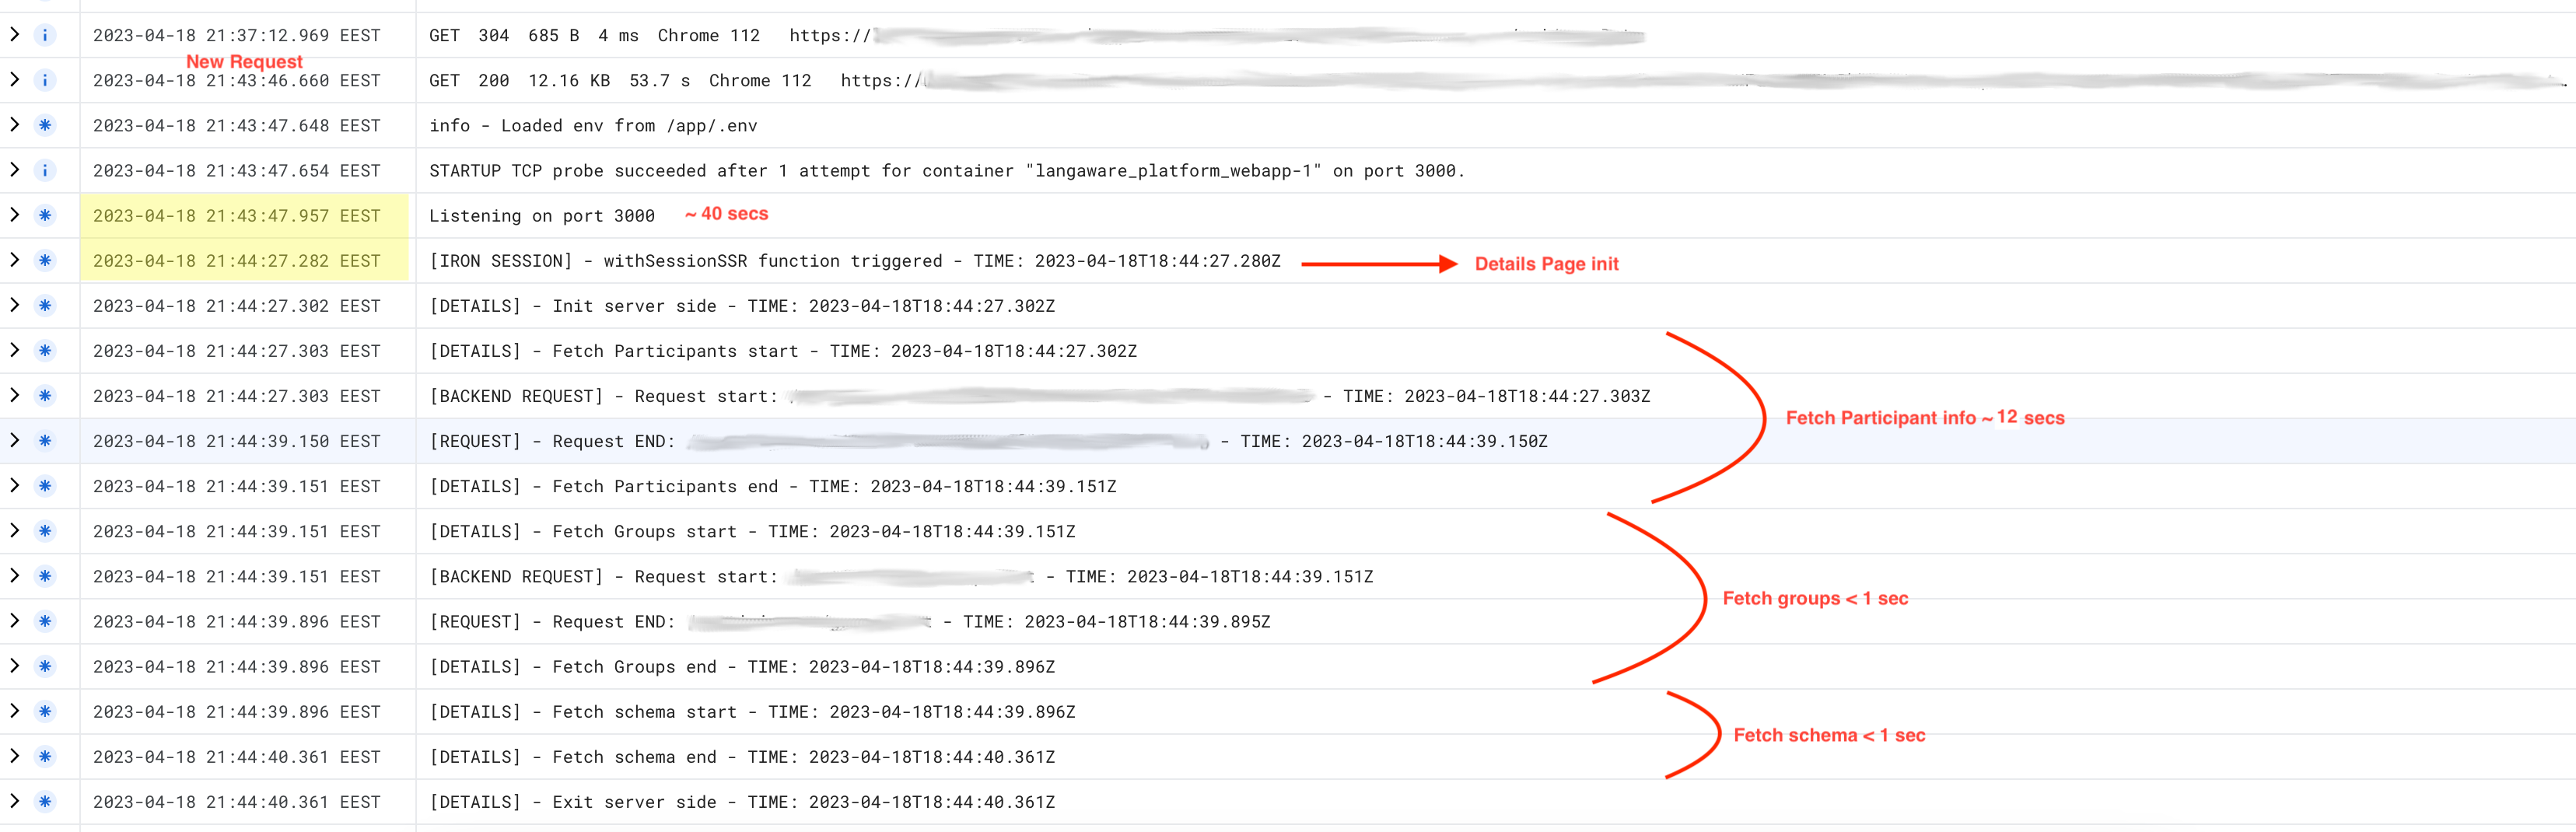
Verify canary release
Provide environment information
Which area(s) of Next.js are affected? (leave empty if unsure)
Data fetching (gS(S)P, getInitialProps), Middleware / Edge (API routes, runtime)
Link to the code that reproduces this issue
https://codesandbox.io/p/sandbox/eager-gagarin-9quspu?file=%2Fpages%2Fironsession.ts&selection=%5B%7B%22endColumn%22%3A20%2C%22endLineNumber%22%3A8%2C%22startColumn%22%3A20%2C%22startLineNumber%22%3A8%7D%5D
To Reproduce
Deploy a Next.js application to Google Cloud Run.
Send requests to the application and observe the response time.
Describe the Bug
I have a Next.js application running in a Google Cloud Run instance, and I'm experiencing intermittent slow responses. Sometimes the response time is around 30 seconds, but other times it can be more than 1 minute. This behaviour is not consistent and happens randomly. Right now, the only known fact is that if traffic is constant, the instance is responding very quickly, but whenever the traffic is dropped, the issue resurfaces.
The problem never happens when executing the same Docker image from a local workstation.
I have reached out to Google Cloud support, and they have informed me that the latencies are originating from the code execution.
Environment:
Dockerfile:
Additional information: It's worth noting that I'm not doing any API requests in the backend of my Next.js application. I'm using Iron Session for authentication, as recommended in the Next.js documentation (link: https://nextjs.org/docs/authentication).
Any help or guidance on how to resolve this issue, debugging, or possible root causes would be greatly appreciated. Thank you!
Expected Behavior
The application should respond in a timely manner, with response times consistently under 10 seconds.
Which browser are you using? (if relevant)
No response
How are you deploying your application? (if relevant)
Google Cloud Run