vergoh / vnstat

vnStat - a network traffic monitor for Linux and BSD
GNU General Public License v2.0
1.36k stars 120 forks source link

vnstat last graphic column in last line is almost always "wrong" in graphical mode #170

Closed gilleslamiral closed 2 years ago

gilleslamiral commented 3 years ago

Example: https://imapsync.lamiral.info/vnstat/vnstati.html The last column at the last line at the right appears almost always wrong for any period since it represents the whole absolute trafic value till the current time for the period visualized. Wrong in the sense that it is too small in regard of graphics above.

Each time I look at them I'm saying to myself "oh it's a small day" or "a small month" or "a small week" but they are not.

The last graphic should represent the mean value of the period for the current time, not the absolute value.

The command line vnstat -hg does not have this issue.

Thanks for this great vnstat tool!

vergoh commented 3 years ago

The last line, being the current 5min/hourly/day/month/year, will obviously show how much traffic has so far been seen during the time period. If the traffic of the system is somewhat predictable, the value of a partial measurement period is going to be less than of a full period. That also results in the graphical bar being shorter than the previous ones unless viewed at the very end of the measurement period or if there's more traffic than usually. Just to clarify: that graphical bar is based on the rx and tx values, not the average rate.

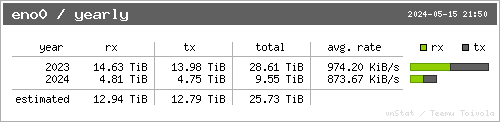
The -hg output (and anything including it) of vnstati also behaves as described if you have the traffic amount selected instead of traffic rate:

vnStat summary animation

Maybe that's the issue here. There's nothing that tells if the graphical bar in those list outputs is generated based on the rx/tx value columns or the traffic rate column (which can be hidden). I'm not sure what would be the best way to tell the difference.

gilleslamiral commented 3 years ago

Even if I know the graphical bar is generated based on the rx/tx value columns, the last column is still confusing. It increases over time as you clearly showed it and doesn't reflect well what it will end with more than half of the time. I have to either ignore it or calculate based on time passed since the beginning of the period. An extrapolation would be a better help. Instead of rx, why not plot rx * p / (t - t0) where p is the period (5min/day/week/month), t0 the time at the beginning of the period and t the current time? How about a test of this?

vergoh commented 3 years ago

Switching between extrapolation and direct value isn't from my point of view going to solve this as long as there's no some sort of indicator visible pointing out which column is being used to create the graphical part. I could try to see how it would look like if the graphical part of the last line would consist of one set of bars drawn using a lighter color as background and then the current graphical element staying as it is. That should result in making the extrapolated data also visible in a way that a quick glance of the graphical element would give enough information.

gilleslamiral commented 3 years ago

I agree that the estimated values on the graph would be nice to see.

The graphs are good to evaluate quickly what is the bandwidth trend over the different periods. The most important value being related to "how will end up the current period compared to the previous ones?" or "Do I have to care about this increase or this decrease trend?".

The user shouldn't have to evaluate the graphical current trend based on what time it is now from the beginning of each period.

vergoh commented 3 years ago

I did few mockups while trying to get some idea what would be the most readable solution for making the information visible. The first test was to make the "estimated" line also have a bar:

image

The second test is with brightness adjusted "estimated" bar on the same line as the current data, under it:

image

The first test is with a grayed "estimated" bar on the same line as the current data:

image

Based on those, I'd say the first option makes the image a little bit too busy and it also results in having to duplicated the average rate (when visible) as that value would anyway be the same on both lines. The "estimated" line also isn't visible in all list output (5 minute, hourly) so it wouldn't be applicable in the same way for all list output options.

The second option looks better but I feel that the bar now having 4 sections doesn't make it look too nice even if the information is there. The third option replicates the style used in the summary output and still carries the necessary information. I feel this is the style that looks the best and wouldn't need a configuration option for making it optional.

As for the implementation: at least the third option should be rather simple to do as the color allocation already exists and the numbers have already been calculated for the estimate line. However, there's a limitation with the current implementation that the information for the lengths of the bars is kind of getting calculated as part of the database query. At that point the visibility of the estimate isn't known and now estimate is being calculated. This would result in a situation that an estimate larger than any of the previous entries wouldn't have the possibility of shrinking the previous bars to the correct ratio. Possibly having a "+" at the end of the estimate bar could be a suitable workaround in that scenario.

gilleslamiral commented 3 years ago

The four sections is very good and reflect well the estimation of what is happening in the current period. This available in all periods is very good too, my brain don't have to think "why this good estimation is missing here?". It should shrink the previous bars because when it happens it's a important piece of information to notice: currently something happens, a big increase regarding the past. Anyway, if + is simple and easy, + is very ok. Thanks so much!

vergoh commented 3 years ago

Sounds like I'll have to add that configuration option for the estimate style after all.

These are now from actual prototype implementations. Creating the offset from the background color works ok since it's likely to be a rather neutral color in most cases:

image

However using even the default rx and tx colors and trying to fade those turned to be a little bit more problematic. As either rx or tx is likely to be some accent color, fading it just by incrementing the rgb values doesn't produce that nice results as libgd doesn't have a built-in color manipulation method. I think the green estimate color in this case should be more muted:

image

As an alternative, using the same color but a thinner bar could be a viable option:

image

vergoh commented 3 years ago

One more alternative without color manipulation but just leaving the rectangle unfilled (well ok, there's a grey fill for better effect):

image

gilleslamiral commented 3 years ago

Well, you could also label the graphical column "rx, tx rates". Then the whole column would be the exact same graphic, except for the last line (the last line being also the rx and tx rates, like the others). Only the last line, the current one, has different sizes between "estimated rx tx" and "rx tx". Graphical representation of "rx tx" and "rx tx rates" are exactly the same for the other lines. It's my point since the beginning, the graphical values rx and tx for "now" are confusing. A problem with the three/four sections on the last line is that we ask ourselves "do the estimated rx tx start at the absolute left or after the current rx tx?". Also confusing.

vergoh commented 3 years ago

"rx / tx rates" doesn't work too well when the "rates" column isn't visible since that's an optional column. Fixing the confusion about "where does the value start" is at least possible by adding some offset: image image image

Not really sure which one of those is the best as that too will also depend on the rate column being visible or not. If it's visible then the last option may look a little bit strange as the estimate line has no rate visible. That would suggest either the first or the second are the better option. At least with these, the non-filled two part bar looks correct.

gilleslamiral commented 3 years ago

The second, half between graphic, looks like a bug. The third, since it is on the labeled "estimated" line, shouldn't be in a different colors. Same colors are not confusing, even if the rate column is missing: the whole line is an estimation, isn't it? My point is still this: the user should not have to look at his watch and compute mentally some arithmetic in order to well interpret what's going on on the graphics.

The optional rate column between the rx tx values and the rx tx graphic takes part in the confusion when reading the graphic.

Anyway, big thanks to consider my point of view. Maybe a UX test could help.

vergoh commented 3 years ago

The second picture keeps the spacing between the bar lines the same, that's why it may be more correct than the third one depending on the point of view (not mine but it was still good to make also that option visible and those are anyway more readable than most of the earlier "one the same line" variations).

The reason why I wouldn't want the estimate bars have the same coloring style than the other bars is that there's needs to be some way of getting a hint that there's a difference even with a quick glance if/when this feature is introduced and enabled by default. If the bars all look the same then some will assume also the estimate line shows the already occured traffic instead of being just a prediction. (Scenario: just by having a quick look, compare the length of the last bar line to the previous ones, essentially only viewing the last column)

The other thing I'm trying to avoid is to make it possible to configure the output in such way that two essentially identical outputs can have a different meaning depending how the configuration options have been set. I understand such would be nice for personal use since the user itself usually knows what the settings locally are and what the intent was but when users start copypasting those images to, for example, forums for comparison then everyone would eventually gets confused if there's no obvious enough visual cue about the possible meaning change.

So yes, this is kind of a balacing act at the same time as needing to come up with the implementation (I'm no longer happy with the idea of having the + at the end of the line for scaling). I'm no graphical designer which is the obvious limitation in these sort of cases.

gilleslamiral commented 3 years ago

We are not going towards a nice solution.

To sum up my need and still respect yours, here is my proposal.

It would be very nice to add an option, not on by default, that makes the current period graphic, the last one, being an estimation based on the current average rates of rx/tx instead of the actual rx/tx. Just that would fulfill my need and liberate your fear of changing the default behavior.

Now the name of the option. How about

LastGraphicValueShownIsEstimated = 1

I don't know the technical struggle to implement this and I'm sorry to not be able to investigate enough time to propose a patch.

Anyway, great thanks to you, do what seems the best.

Keep going the discussion if it has to.

vergoh commented 3 years ago

Hopefully this is the last set of images I copypaste to this issue. :-)

Current output style image

What you'd want to see? image

I did manage to fit the "rate" text to the rx / tx legend part which is enough difference for me to indicate what that column is trying to visualize.

The implementation would add some new option to the configuration file which requires OutputStyle to have a value of 3 (which is the default) in order for this new option to have any effect. When enabled, the value of EstimateBarVisible would get ignored.

gilleslamiral commented 3 years ago

It's just sound perfect to me!

Maybe the "estimated" line could have also the value of "avg. rate", and also the graphic by the way. It's redundant but it clarifies what the estimated line is: rx and tx "would be" values based on the current "avg. rate", over this period. Anyway, without that redundancy is very ok.

vergoh commented 3 years ago

I had the average rate on the estimated line with the graphical element in an earlier mockup above and felt that it made quickly finding the last relevant data line slower and made the image feel too busy. That's why it's still not included. As for everything else, the implementation is there in that last commit for you to test if you want and it should be possible to close this issue, unless I missed something.

gilleslamiral commented 2 years ago

Hi!

I have the following setup setup with vnstat 2.7:

Graphics for 5 minutes, hourly, daily and monthly are ok, they all have an accurate "rx tx rate" bar. But the yearly doesn't have a "rx tx rate" bar for the current year.

Year image https://imapsync.lamiral.info/vnstat/vnstat_y.png

All images: https://imapsync.lamiral.info/vnstat/vnstati.html

Am I doing something wrong? or a bug?

# output style
# 0 = minimal & narrow, 1 = bar column visible
# 2 = same as 1 except rate in summary
# 3 = rate column visible
OutputStyle 3
EstimateBarVisible 1

# traffic estimate bar style
# (0 = not shown, 1 = continuation of existing bar, 2 = separate bar)
EstimateStyle 0

# bar column in list outputs shows rate if OutputStyle is 3
# (1 = enabled, 0 = disabled)
BarColumnShowsRate 1
vergoh commented 2 years ago

Looks like some sort of bug. I can't see this occuring with the default configuration so there's likely to be some condition missing for the yearly output as the function generating those lists is otherwise shared for all outputs.

I'll reopen this and see if I can get the issue replicated with your configuration.

vergoh commented 2 years ago

That bar got hidden if EstimateStyle was 0, BarColumnShowsRate was 1 and the last line had a higher traffic rate than other lines. In that scenario the maximum traffic sum used for scaling the bars didn't get updated to match the higher than previous values calculated estimate and the bar drawing function then didn't draw the bar as it identified higher than given maximum input. This wasn't specific to the yearly output but all list outputs.

gilleslamiral commented 2 years ago

Thanks for fixing this!