 egthomas
commented
6 years ago
egthomas
commented
6 years ago @ksterne - are you sure davitpy is plotting the potential contours correctly? The attached figure is what I get from the Map Potential Plot tool on the VT website (http://vt.superdarn.org/tiki-index.php?page=DaViT+Map+Potential+Plot) for a "map2" file:

 ksterne
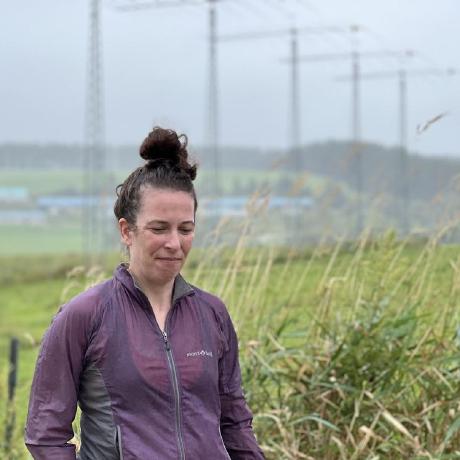 aburrell


 Shirling-VT

 asreimer
This pull request is to update davitpy with the new file types available with RST 4.1. These are fitacf3 (though optional for now), grid2, and map2. I've also updated the
sdDataTypes"unit" test section which must have been out of date when grid/map files were reprocessed. In addition to fixing the current tests there, I added ones that will pull the new grid2, map2 files as well as added a section to theradDataTypes"unit" test section to include pulling a fitacf3 file. The focus here was mostly to enable the new files types in thesdio/directory, but I also added the new files types in some of the documentation in theplotting/directory.Otherwise, please use these codes to test things here:
results in:
results in:
Since theses are new filetypes, there are limited amounts of either on the sd-data.ece.vt.edu server. Grid2/map2 files are available for mostly of 2017 and fitacf3 files are available from 20171201 to near present (have had to revert to rst4.0 to catch up on old data type reprocessing).