Closed zionLi3 closed 1 year ago
I'm trying to finish up version 4.0.0 of both DearEIS and pyimpspec. That work will hopefully be ready soon but it does mean that I'm reluctant to add features as part of a new version 3.x.x release. However, I can see about adding support for batch analysis in the GUI for version 4.0.0.
Unfortunately, I'm not sure how soon version 4.0.0 will be released. I still have a few urgent tasks on the list of stuff to do before release. These tasks include both changes to the codebase and updating the documentation.
If this is an urgent matter and you are familiar with Python, then I would recommend using DearEIS' (or pyimpspec's) API to perform the batch analysis.
In your examples, Batch processing results shows how to batch process DRT analysis, but it uses all methods. My analysis speed is very slow. Can I select only one method (such as TR-RBF) for analysis?
I'm not sure what you mean by "uses all methods". Which example are you referring to? Yes, you can choose which method to use. The calculate_drt
functions found in the DearEIS and the pyimpspec APIs only use one method at a time. The following is a slightly modified version of what can be found in this Jupyter notebook (input 21):
import deareis
project: deareis.Project = deareis.Project.from_file("some path")
data: deareis.DataSet
for data in project.get_data_sets():
drt: DRTResult = deareis.calculate_drt(data, deareis.DRTSettings(
method=deareis.DRTMethod.TR_RBF,
rbf_type=deareis.RBFType.GAUSSIAN,
rbf_shape=deareis.RBFShape.FWHM,
shape_coeff=0.5,
derivative_order=1,
num_samples=10000,
num_attempts=5,
maximum_symmetry=0.5,
mode=deareis.DRTMode.COMPLEX,
lambda_value=-1.0,
inductance=False,
credible_intervals=False,
# The rest are not relevant for this method,
# but these would be always be included when using the GUI
circuit=None,
W=0.15,
num_per_decade=50,
))
project.add_drt(data, drt)
# You can also provide the `save` method with a `path`
# argument to save the modified project to another file.
project.save()
Some methods are slower than others. For example, BHT and TR-RBF are slower than TR-NNLS. The settings can also have a significant impact on how long it takes. For example, for the TR-RBF method the following parameters can greatly affect how long it takes:
credible_intervals=True
adds another part to the analysis, which is then affected by the num_samples
parameterlambda_value
parameter) will also make the analysis take longer since multiple values will be tested in an attempt to find a suitable valueI'm trying to finish up version 4.0.0 of both DearEIS and pyimpspec. That work will hopefully be ready soon but it does mean that I'm reluctant to add features as part of a new version 3.x.x release. However, I can see about adding support for batch analysis in the GUI for version 4.0.0.
Unfortunately, I'm not sure how soon version 4.0.0 will be released. I still have a few urgent tasks on the list of stuff to do before release. These tasks include both changes to the codebase and updating the documentation.
If this is an urgent matter and you are familiar with Python, then I would recommend using DearEIS' (or pyimpspec's) API to perform the batch analysis.
In your examples, Batch processing results shows how to batch process DRT analysis, but it uses all methods. My analysis speed is very slow. Can I select only one method (such as TR-RBF) for analysis?
I'm not sure what you mean by "uses all methods". Which example are you referring to? Yes, you can choose which method to use. The
calculate_drt
functions found in the DearEIS and the pyimpspec APIs only use one method at a time. The following is a slightly modified version of what can be found in this Jupyter notebook (input 21):import deareis project: deareis.Project = deareis.Project.from_file("some path") data: deareis.DataSet for data in project.get_data_sets(): drt: DRTResult = deareis.calculate_drt(data, deareis.DRTSettings( method=deareis.DRTMethod.TR_RBF, rbf_type=deareis.RBFType.GAUSSIAN, rbf_shape=deareis.RBFShape.FWHM, shape_coeff=0.5, derivative_order=1, num_samples=10000, num_attempts=5, maximum_symmetry=0.5, mode=deareis.DRTMode.COMPLEX, lambda_value=-1.0, inductance=False, credible_intervals=False, # The rest are not relevant for this method, # but these would be always be included when using the GUI circuit=None, W=0.15, num_per_decade=50, )) project.add_drt(data, drt) # You can also provide the `save` method with a `path` # argument to save the modified project to another file. project.save()
Some methods are slower than others. For example, BHT and TR-RBF are slower than TR-NNLS. The settings can also have a significant impact on how long it takes. For example, for the TR-RBF method the following parameters can greatly affect how long it takes:
credible_intervals=True
adds another part to the analysis, which is then affected by thenum_samples
parameter- not providing a regularization parameter (i.e. not providing a positive value for the
lambda_value
parameter) will also make the analysis take longer since multiple values will be tested in an attempt to find a suitable value
Thank you very much! I have realized the analysis I want through DearEIS' API. This is really a very useful program.
Version 4.0.0 is out now and has support for performing batch analyses via the GUI.
版本 4.0.0 现已发布,支持通过 GUI 执行批处理分析。
I would like to express my sincere gratitude! I have a small question that I'd like to kindly inquire about. DRT (Distribution of Relaxation Times) is commonly used to describe resistive-capacitive behavior. However, this method does not accurately describe phenomena such as inductive effects at very high frequencies and solid-state diffusion processes at low frequencies. In order to more precisely analyze EIS (Electrochemical Impedance Spectroscopy) data, it is necessary to preprocess the data. May I kindly ask how I can achieve the Preprocessed EIS effect as shown in the figure below using DearEIS? (From https://doi.org/10.1016/j.est.2022.105386)
If we use your example, then I think the steps would be as follows:
Data sets
tab so that only the low-frequency portion is visible.CDC - extended
) for the fitted circuit.Data sets
tab, click Process
, and open up the Subtract impedance
window.Circuit
option, paste the CDC that you copied into the input, remove the series resistance (either by deleting the R{R=...}
part of the CDC or via the graphical editor that you can open by clicking the Edit
button), and click Accept
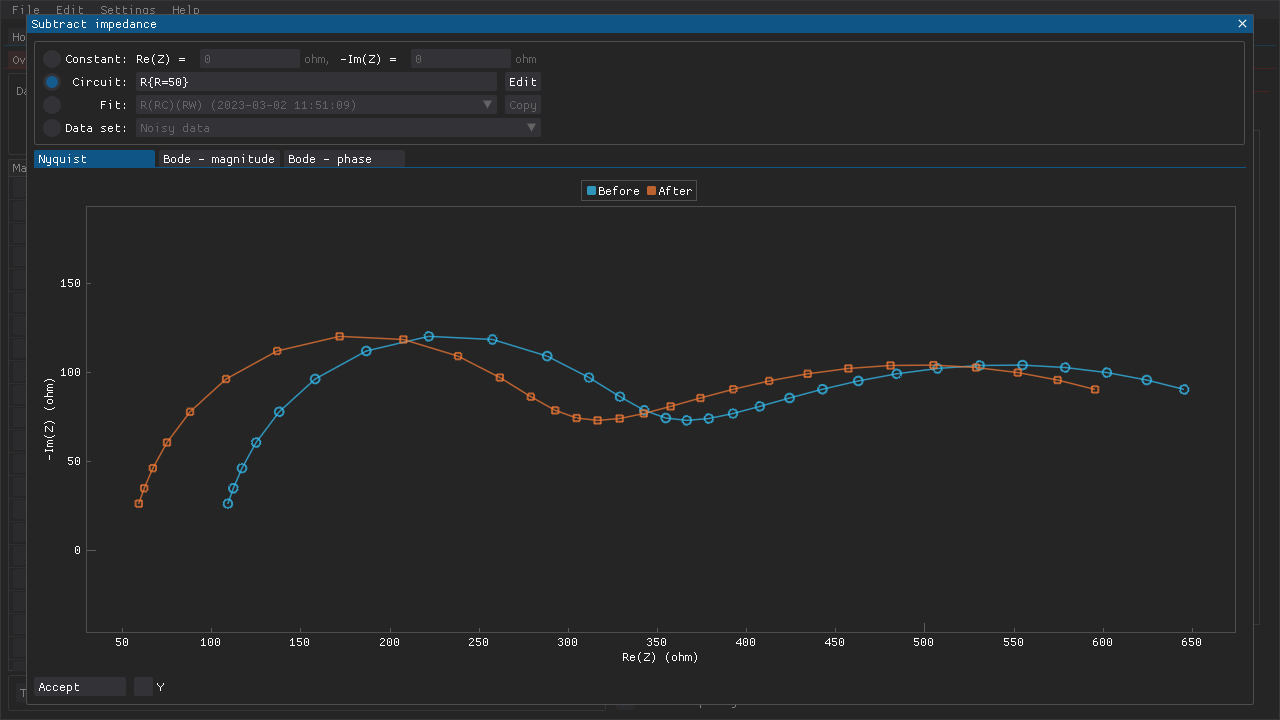
.EDIT: I have added a Copy
button next to the combo box for selecting fit results (see screenshot below) in the latest version.
Clicking on that button copies the chosen fitted circuit to the option above and opens up the graphical editor so that, e.g., the series resistance can be removed. This removes the intermediate step of copying the extended CDC and thus makes it more convenient to do this kind of preprocessing of multiple spectra after batch fitting a circuit to the low-frequency portions of those spectra.
I have a large amount of data. I need to conduct DRT analysis on the data sets of a project in batches in the GUI interface according to the same method, or I need to click again and again.
In your examples, Batch processing results shows how to batch process DRT analysis, but it uses all methods. My analysis speed is very slow. Can I select only one method (such as TR-RBF) for analysis?
Thank you very much indeed!