 Machi3mfl
commented
1 year ago
Machi3mfl
commented
1 year ago Research
- Research about implementation cost on dashboard upgrade
Current dashboard implementations
components involved in rendering visualizations in dashboards:
- WzVisualize (
public/components/visualize/wz-visualize.js) - KibanaVis (
public/kibana-integrations/kibana-vis.js)
All these components are custom react components
sequenceDiagram

(some) Dashboard->>WzVisualize: use wz-visualize to render the visualizations
WzVisualize-->>KibanaVis: load the visualizations for the current dashboard
loop
    KibanaVis->>KibanaVis: WzVisualize uses the KibanaVis depending on the number of vis defined for the dashboard
end
Note right of KibanaVis: The KibanaVis component receives the vis ID to get the vis definition
The dashboard configurations are defined in (public/components/visualize/visualizations.js)
For instance:
export const visualizations = {
  general: {
    rows: [
      {
        height: 360,
        vis: [
          {
            title: 'Alerts evolution - Top 5 agents',
            id: 'Wazuh-App-Overview-General-Alerts-evolution-Top-5-agents',
            width: 70
          },
          {
            title: 'Top MITRE ATT&CKS',
            id: 'Wazuh-App-Overview-General-Alerts-Top-Mitre',
            width: 40
          }
        ]
      }
    ]
  },
]
The visualizations are definitions are the server-side: /server/integration-files/visualizations
For instance (The security events dashboard - without agent pinned):
export default [
  {
    _id: 'Wazuh-App-Overview-General-Agents-status',
    _source: {
      title: 'Agents status',
      visState: JSON.stringify({
        title: 'Agents Status',
        type: 'histogram',
        params: {
          type: 'histogram',
          grid: { categoryLines: false, style: { color: '#eee' } },
          categoryAxes: [
            {
              id: 'CategoryAxis-1',
              type: 'category',
              position: 'bottom',
              show: true,
              style: {},
              scale: { type: 'linear' },
              labels: { show: true, filter: true, truncate: 100 },
              title: {},
            },
          ],
          valueAxes: [
            {
              id: 'ValueAxis-1',
              name: 'LeftAxis-1',
              type: 'value',
              position: 'left',
              show: true,
              style: {},
              scale: { type: 'linear', mode: 'normal' },
              labels: { show: true, rotate: 0, filter: false, truncate: 100 },
              title: { text: 'Count' },
            },
          ],
          seriesParams: [
            {
              show: true,
              mode: 'normal',
              type: 'line',
              drawLinesBetweenPoints: true,
              showCircles: true,
              interpolate: 'cardinal',
              lineWidth: 3.5,
              data: { id: '4', label: 'Unique count of id' },
              valueAxis: 'ValueAxis-1',
            },
          ],
          addTooltip: true,
          addLegend: true,
          legendPosition: 'right',
          times: [],
          addTimeMarker: false,
        },
        aggs: [
          {
            id: '2',
            enabled: true,
            type: 'date_histogram',
            interval: '1ms',
            schema: 'segment',
            params: {
              field: 'timestamp',
              interval: '1ms',
              customInterval: '2h',
              min_doc_count: 1,
              extended_bounds: {},
            },
          },
          {
            id: '3',
            enabled: true,
            type: 'terms',
            schema: 'group',
            params: { field: 'status', size: 5, order: 'desc', orderBy: '_term' },
          },
          {
            id: '4',
            enabled: true,
            type: 'cardinality',
            schema: 'metric',
            params: { field: 'id' },
          },
        ],
      }),
      uiStateJSON: JSON.stringify({
        vis: { colors: { active: UI_COLOR_AGENT_STATUS.active, disconnected: UI_COLOR_AGENT_STATUS.disconnected, pending: UI_COLOR_AGENT_STATUS.pending, never_connected: UI_COLOR_AGENT_STATUS.never_connected } },
      }),
      description: '',
      version: 1,
      kibanaSavedObjectMeta: {
        searchSourceJSON: JSON.stringify({
          index: 'wazuh-monitoring',
          filter: [],
          query: { query: '', language: 'lucene' },
        }),
      },
    },
    _type: 'visualization',
}, chantal-kelm
Description
Following the release of our integrations' documentation, we want to incorporate the new dashboards into our main application.
Functional requirements
Non-functional requirements
Implementation restrictions
Plan
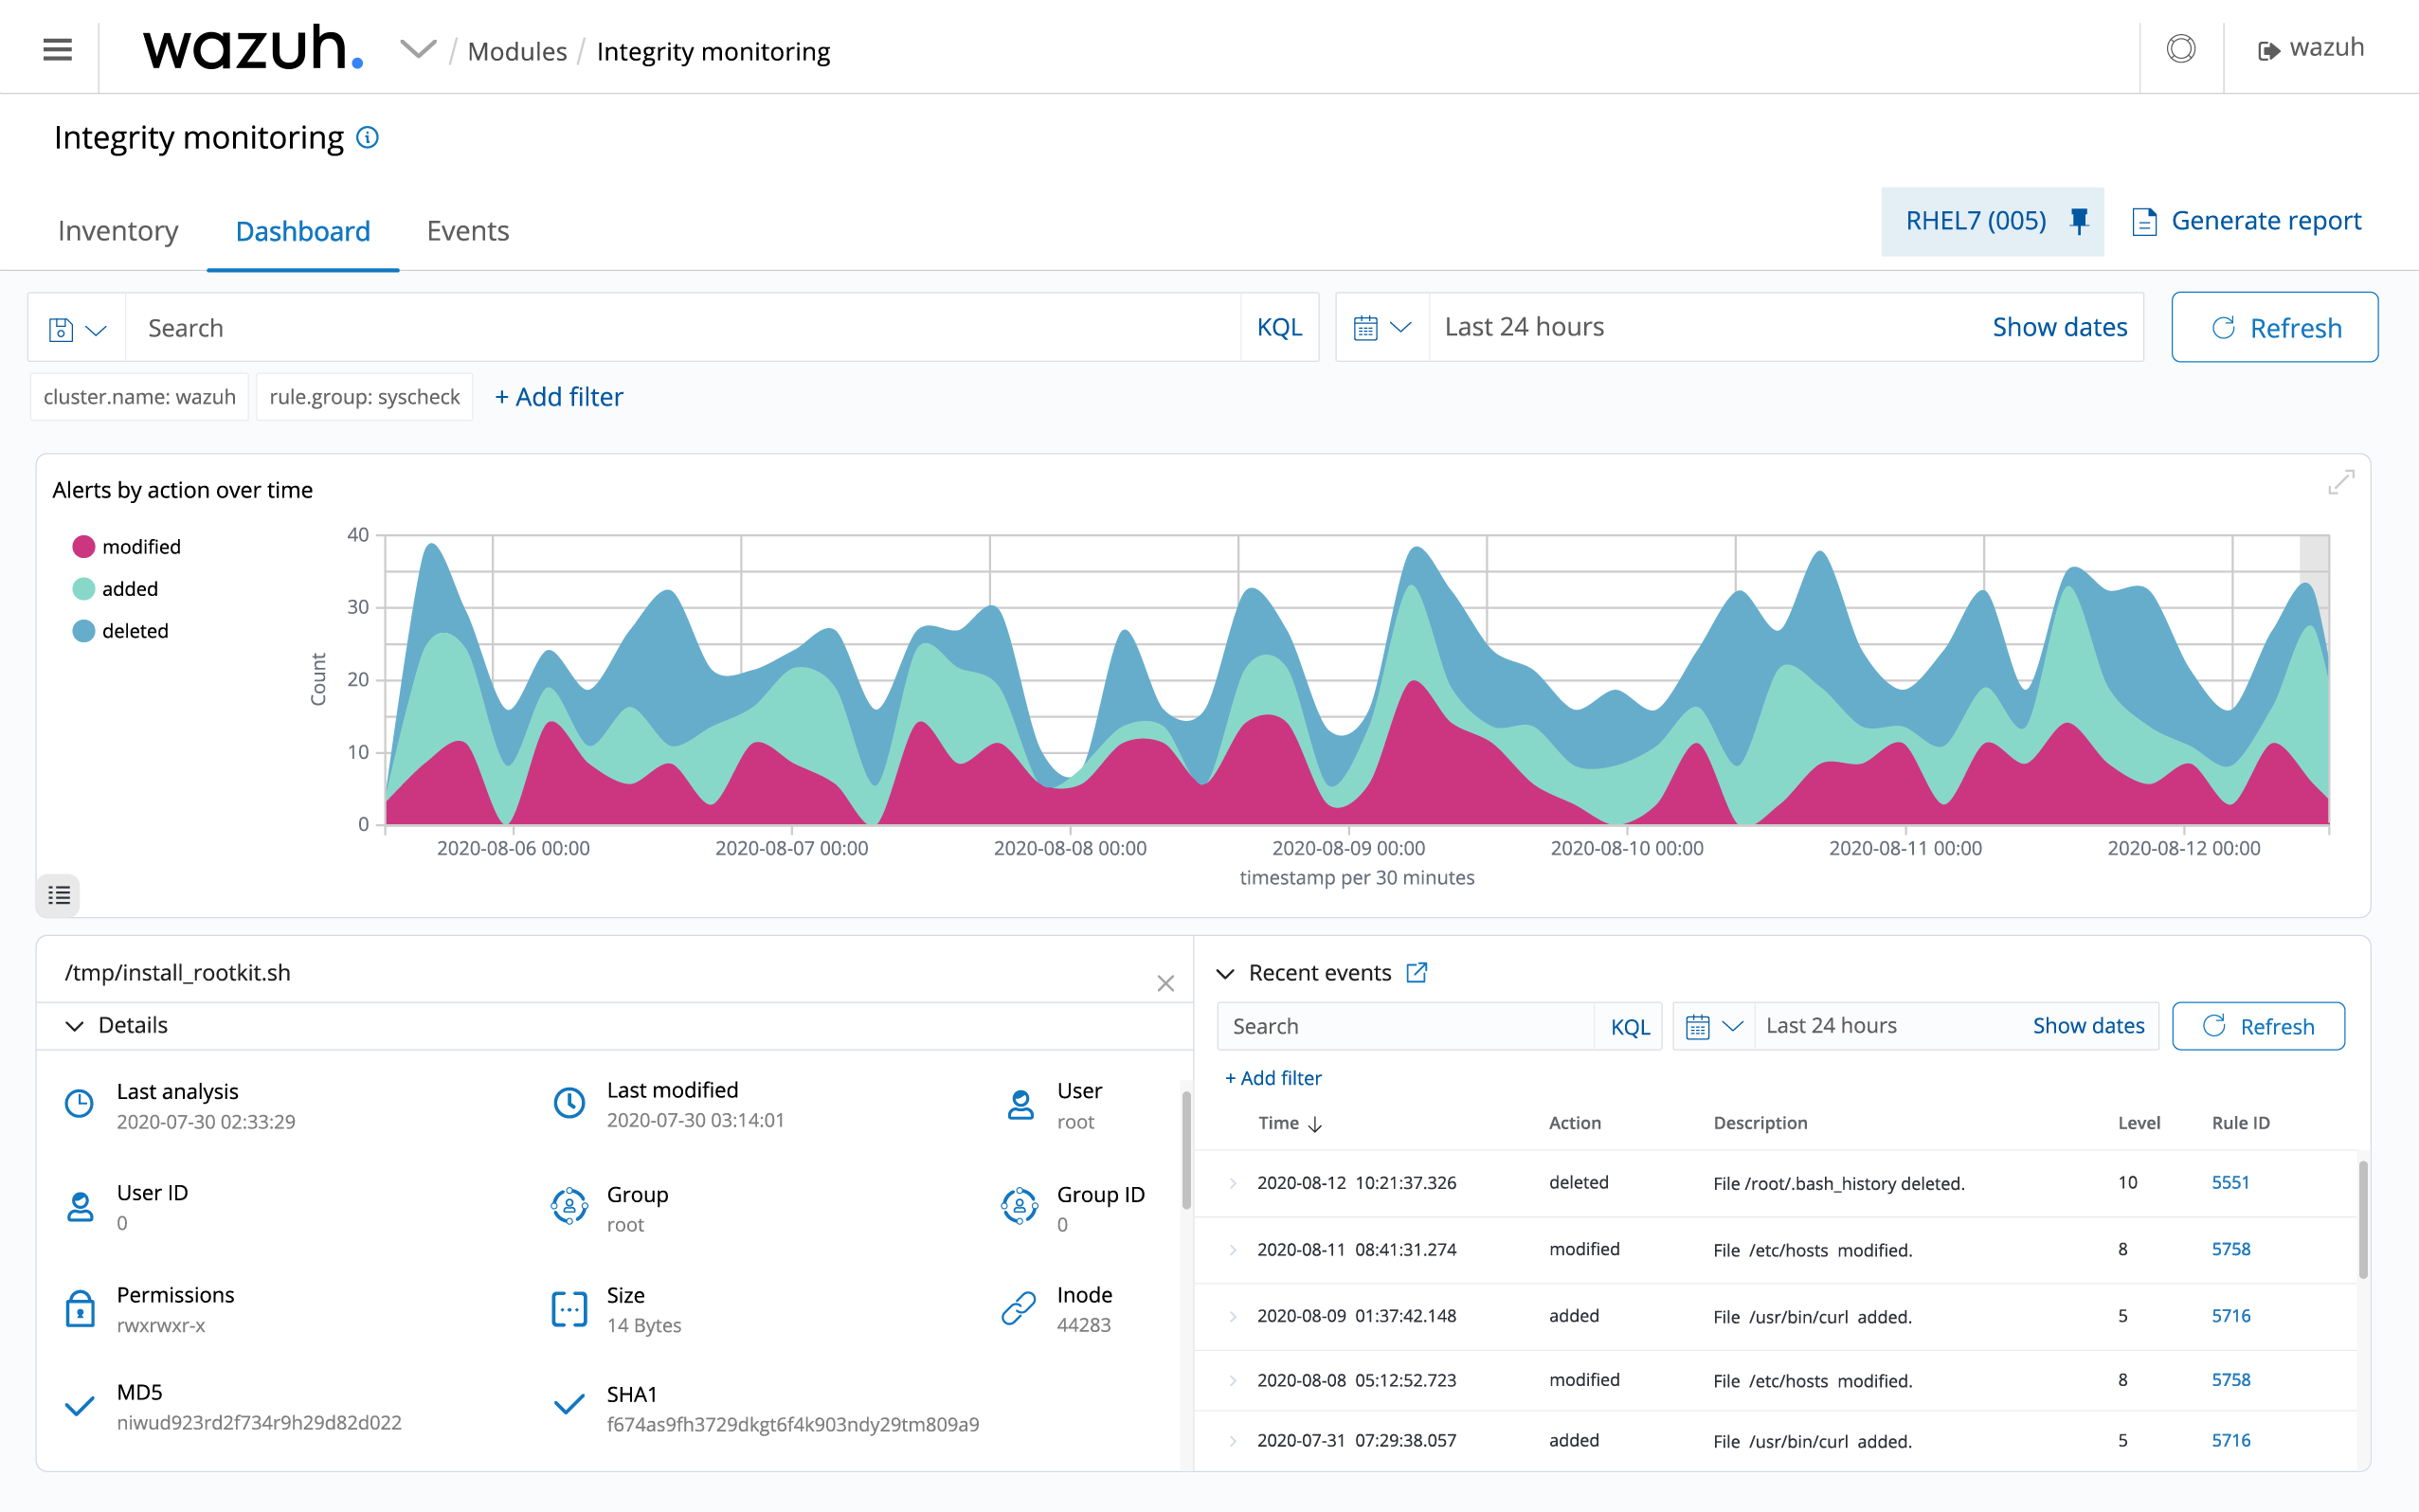
After implementing the dashboard log data analysis in our plugin, we will have to develop a flyout when clicking on the data in the table.After implementing the dashboard integrity monitoring in our plugin, we will have to develop a flyout when clicking on the data in the table.