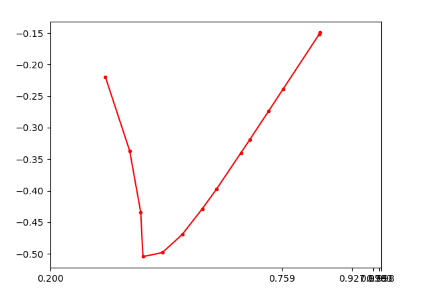
@izmailovpavel may have the notebook still, but try plotting on a log scale for x. Also double check that your signs are correct as they potentially could be flipped.
Closed Codefmeister closed 2 years ago
@izmailovpavel may have the notebook still, but try plotting on a log scale for x. Also double check that your signs are correct as they potentially could be flipped.
Thank you! I have tried log scale but it seems a little bit strange, maybe I should define a proper transformation for the xsticks. And I will be extremely appreciated if gentleman @izmailovpavel could provide some clues for reproducing this beautiful figure. Thanks for your kindness.
Hey @Codefmeister, something seems strange in how your xticks are arranged. Here's our code for making the plots
styles = {name: (label, color) for (name, label, _, color) in new_methods().name_marker_pairs}

methods = {'SWAG-Cov', 'SWA-temp', 'SWA-Drop', 'SGD', 'SWAG-Diag', 'Laplace-SGD', 'SGLD'}

from matplotlib.ticker import FormatStrFormatter

class CustomScale(mscale.ScaleBase):
    name = 'custom'
    eps = 0.002

    def __init__(self, axis, **kwargs):
        mscale.ScaleBase.__init__(self)
        self.thresh = None #thresh

    def get_transform(self):
        return self.CustomTransform(self.thresh)

    def set_default_locators_and_formatters(self, axis):
        pass

    class CustomTransform(mtransforms.Transform):
        input_dims = 1
        output_dims = 1
        is_separable = True

        def __init__(self, thresh):
            mtransforms.Transform.__init__(self)
            self.thresh = thresh

        def transform_non_affine(self, a):
            return -np.log(1 + CustomScale.eps - a)

        def inverted(self):
            return CustomScale.InvertedCustomTransform(self.thresh)

    class InvertedCustomTransform(mtransforms.Transform):
        input_dims = 1
        output_dims = 1
        is_separable = True

        def __init__(self, thresh):
            mtransforms.Transform.__init__(self)
            self.thresh = thresh

        def transform_non_affine(self, a):
            return 1 + CustomScale.eps - np.exp(-a)

        def inverted(self):
            return CustomScale.CustomTransform(self.thresh)
mscale.register_scale(CustomScale)

fig, axes = plt.subplots(figsize=(37, 8), nrows=1, ncols=4)
plt.subplots_adjust(wspace=0.3, bottom=0.25)

def calibration_plot(results, ds, model):
    for method, curve in sorted(results.items()):
        #print(method, 'YN'[int(curve is None)])
        if method not in methods:
            continue
        label, color = styles[method]
        if curve is not None:
            plt.plot(curve['confidence'], curve['confidence'] - curve['accuracy'], linewidth=4, marker='o', markersize=8,
                    color=color, label='%s' % (label), zorder=3)
    plt.plot(np.linspace(0.1, 1.0, 100), np.zeros(100), 'k--', dashes=(5, 5), linewidth=3, zorder=2)

    plt.gca().set_xscale('custom')

    ticks = 1.0 - np.logspace(np.log(0.8), np.log(0.002), 6, base=np.e)
    plt.xticks(ticks, fontsize=22)
    plt.yticks(fontsize=22)
    plt.gca().yaxis.set_major_formatter(FormatStrFormatter('%.2f'))
    plt.gca().xaxis.set_major_formatter(FormatStrFormatter('%.3f'))
    plt.margins(x=0.03)
    plt.ylabel('Confidence - Accuracy', fontsize=28)
    plt.xlabel('Confidence (max prob)', fontsize=28)
    plt.title('%s %s' % (model, ds), fontsize=28, y=1.02)
    plt.grid()

plt.sca(axes[0])
calibration_plot(load_dict('./data/calibrations/c100_wrn_new.pkl'), 'CIFAR-100', 'WideResNet28x10')
plt.sca(axes[1])
calibration_plot(load_dict('./data/calibrations/stl_wrn.pkl'), 'CIFAR-10 $\\rightarrow$ STL-10', 'WideResNet28x10')
plt.sca(axes[2])
calibration_plot(load_dict('./data/calibrations/imagenet_densenet161.pkl'), 'ImageNet', 'DenseNet-161')
plt.sca(axes[3])
calibration_plot(load_dict('./data/calibrations/imagenet_resnet152.pkl'), 'ImageNet', 'ResNet-152')

#plt.sca(axes[1])

handles, labels = axes[0].get_legend_handles_labels()
leg = plt.figlegend(handles, labels, fontsize=28, loc='lower center', bbox_to_anchor=(0.43, 0.0), ncol=6)
for legobj in leg.legendHandles:
    legobj.set_linewidth(6.0)
    legobj._legmarker.set_markersize(12.0)

plt.savefig('./pics/calibration_curves.pdf', format='pdf', bbox_inches='tight')
plt.show()
It was originally written by @timgaripov.
For another paper, I used this code to plot the calibration curves, which is a lot simpler:
plt.figure(figsize=(3, 3))
def plot_calibration(arr):
    plt.plot(arr["confidence"], arr["accuracy"] - arr["confidence"],
             "-o", color=arr["color"], mec="k", ms=7, lw=3)

# plot_calibration({**matt_arr["deep_ensemble_calibration"], "color": de_color})
plot_calibration({**new_calibration_arr["deep_ensemble"].item(), "color": de_color})
plot_calibration({**new_calibration_arr["sgld"].item(), "color": sgld_color})
plot_calibration({**new_calibration_arr["sgld_mom_clr_prec"].item(), "color": sgld_hot_color})
plot_calibration({**matt_arr["hmc_calibration"], "color": "orange"})
# plot_calibration({**matt_arr["sgld_calibration"], "color": sgld_color})
# plot_calibration({**matt_arr["sgld_hot_calibration"], "color": sgld_hot_color})
plt.hlines(0., 0., 1., color="k", linestyle="dashed")
plt.xticks(fontsize=14)
plt.yticks(fontsize=14)
plt.xlabel("Confidence", fontsize=16)
plt.ylabel("Accuracy - Confidence", fontsize=16)
plt.grid()
plt.xlim(0.35, 1.05)
plt.savefig("calibration_curve.pdf", bbox_inches="tight")Thanks for your kindness. It's very helpful.
Hello, Thanks for your great code. But while plotting the relability diagram according to your paper, i met some problems. The sticks of my plotting are in a huddle. Could you plz give the plotting code for reference? Thanks!
