wwmm / easyeffects

Limiter, compressor, convolver, equalizer and auto volume and many other plugins for PipeWire applications
GNU General Public License v3.0
6.45k stars 269 forks source link

[feature request] waveform plot (separate effect or mode for upper analyzer) #3087

Open derVedro opened 5 months ago

derVedro commented 5 months ago

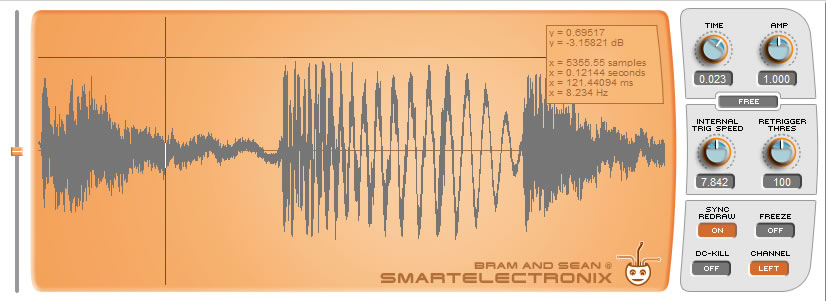
I would like to be able to view the last 5-10s of the audio signal in the waveform display along with its levels. I like to adjust some settings for dynamic processing by my eyes seeing the sound wave. So I would like to be able to do this with a separate effect or by switching the upper spectrum analyzer to waveform display mode.

wwmm commented 5 months ago

I would like to be able to view the last 5-10s of the audio signal in the waveform display

Depending on the situation this may be a lot of data. It may be hard to understand what is in the image.

violetmage commented 5 months ago

@wwmm Not sure if this is helpful, but from OP's description I'm envisioning something similar to how a DAW or Audacity displays waveforms in the timeline.

wwmm commented 5 months ago

@wwmm Not sure if this is helpful, but from OP's description I'm envisioning something similar to how a DAW or Audacity displays waveforms in the timeline.

That is what I understood. It can be something interesting to see in some situations. But depending on the sampling rate 5s or 10 seconds of data may have so much you won't be able to see the details.

derVedro commented 5 months ago

@violetmage got me right. I would like to see a waveform like in s(M)exoscope.

@wwmm Not sure if this is helpful, but from OP's description I'm envisioning something similar to how a DAW or Audacity displays waveforms in the timeline.

That is what I understood. It can be something interesting to see in some situations. But depending on the sampling rate 5s or 10 seconds of data may have so much you won't be able to see the details.

Hmmm, there is no need to store all samples in a buffer. Every column of pixel in the plot is just an averaged window for a bunch of samples. I think an int[display_width] array is good enough to do the job. The 10s time could also be a little too much, of course I would be happy to work with less resolution too.

wwmm commented 5 months ago

Hmmm, there is no need to store all samples in a buffer.

I was not thinking about the storage size but about the visualization of the data in the chart. Ten seconds of data at a high sampling rate can easily produce more points per pixel than is possible to see in the chart. So some kind of average would have to be done. But each downsampling method fidelity loss may make the whole thing useless. It will depend on what is intended to do with the plot.

derVedro commented 5 months ago

I was not thinking about the storage size but about the visualization of the data in the chart. Ten seconds of data at a high sampling rate can easily produce more points per pixel than is possible to see in the chart. So some kind of average would have to be done. But each downsampling method fidelity loss may make the whole thing useless. It will depend on what is intended to do with the plot.

Yes of course some average had to be done. To display every sample as a point is nonsense. May be an extra duration controller for the size of the time window would be useful. My use cases are: finding a proper threshold value for compressor / visual control of compressor's work (I use the compressor/expander a lot if I look some shitty lecture recordings).