xrobin / pROC

Display and analyze ROC curves in R and S+
https://cran.r-project.org/web/packages/pROC/
GNU General Public License v3.0
121 stars 31 forks source link

Optimize threshold determination with algorithm=2 #44

Closed xrobin closed 5 years ago

xrobin commented 5 years ago

Too much time is spent in roc.utils.R:60 in roc.utils.perfs.all.fast:

dups.sesp <- duplicated(matrix(c(se, sp), ncol=2), MARGIN=1)

There must be a better way to do it. Here is some benchmarking code:

n <- 1e6
dat <- data.frame(x = rnorm(n), y = sample(c(0:1), size = n, replace = TRUE))

library(profvis)
profvis({
    for (i in 1:10) {
        pROC::roc(dat$y, dat$x, algorithm = 2)
    }

})
xrobin commented 5 years ago

It turns out duplicated.matrix is slow. It can be replaced by two calls to duplicated.vector and a vector &.

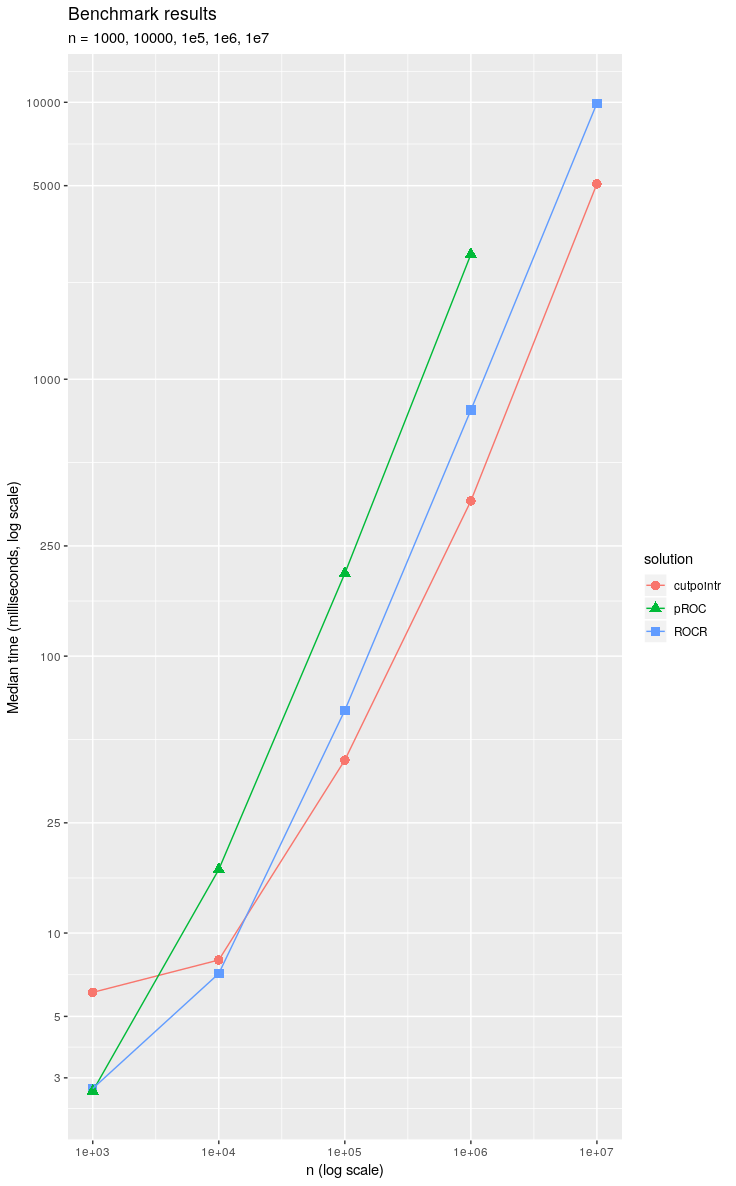
Using the benchmarks from the cutpointr vignette, we are down to nearly the speed of ROCR, despite some remaining inefficient calls to sort, unique, duplicated and %in%.
Rplot Rplot01