 yasenh
commented
3 years ago
yasenh
commented
3 years ago Update: the "inference time" should be "post process time"
Hi @sudapure, thanks for the feedback! I did some test on my end with same set of images, same model and count time for inference + nms parts. So the yolov5 python takes ~0.015s to process an image, and the libtorch one takes ~0.012s to process the image
I put the timer in detector.cpp (similar to what yolov5 python version):

There is the result for 5 images:

Question: are you use GPU version or CPU version?
Some quick solution I can think about now is to use the nms TorchVision, I didn't put it here because I want to minimize the amount of dependencies in this project, but I would suggest you to give a try if latency is the concern. And meanwhile I will try to optimize the current implementation as much as possible.
 sudapure
 mheriyanto


 pengyang1225
 sainttelant
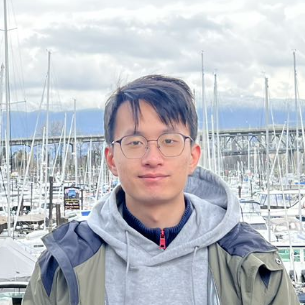 ganler

 mojiayuan
 longjiu
model forwarding takes only ~5 ms to infer the input blob, but post processing takes about 50 ms , i wonder as pytorch implementation(python) takes only 15 ms for both infer and post processing , but here it's taking too long for post-processing, is there any way to optimize post-processing for low latency.