zadam / trilium

Build your personal knowledge base with Trilium Notes
GNU Affero General Public License v3.0
26.15k stars 1.79k forks source link

[Improvement]Improve the default layout of the link map #2064

Open oshino29 opened 2 years ago

oshino29 commented 2 years ago

Currently in Trilium, there will be a random layout generated for a note's link map everytime I open it. this can get very messy when there are too many linked notes:

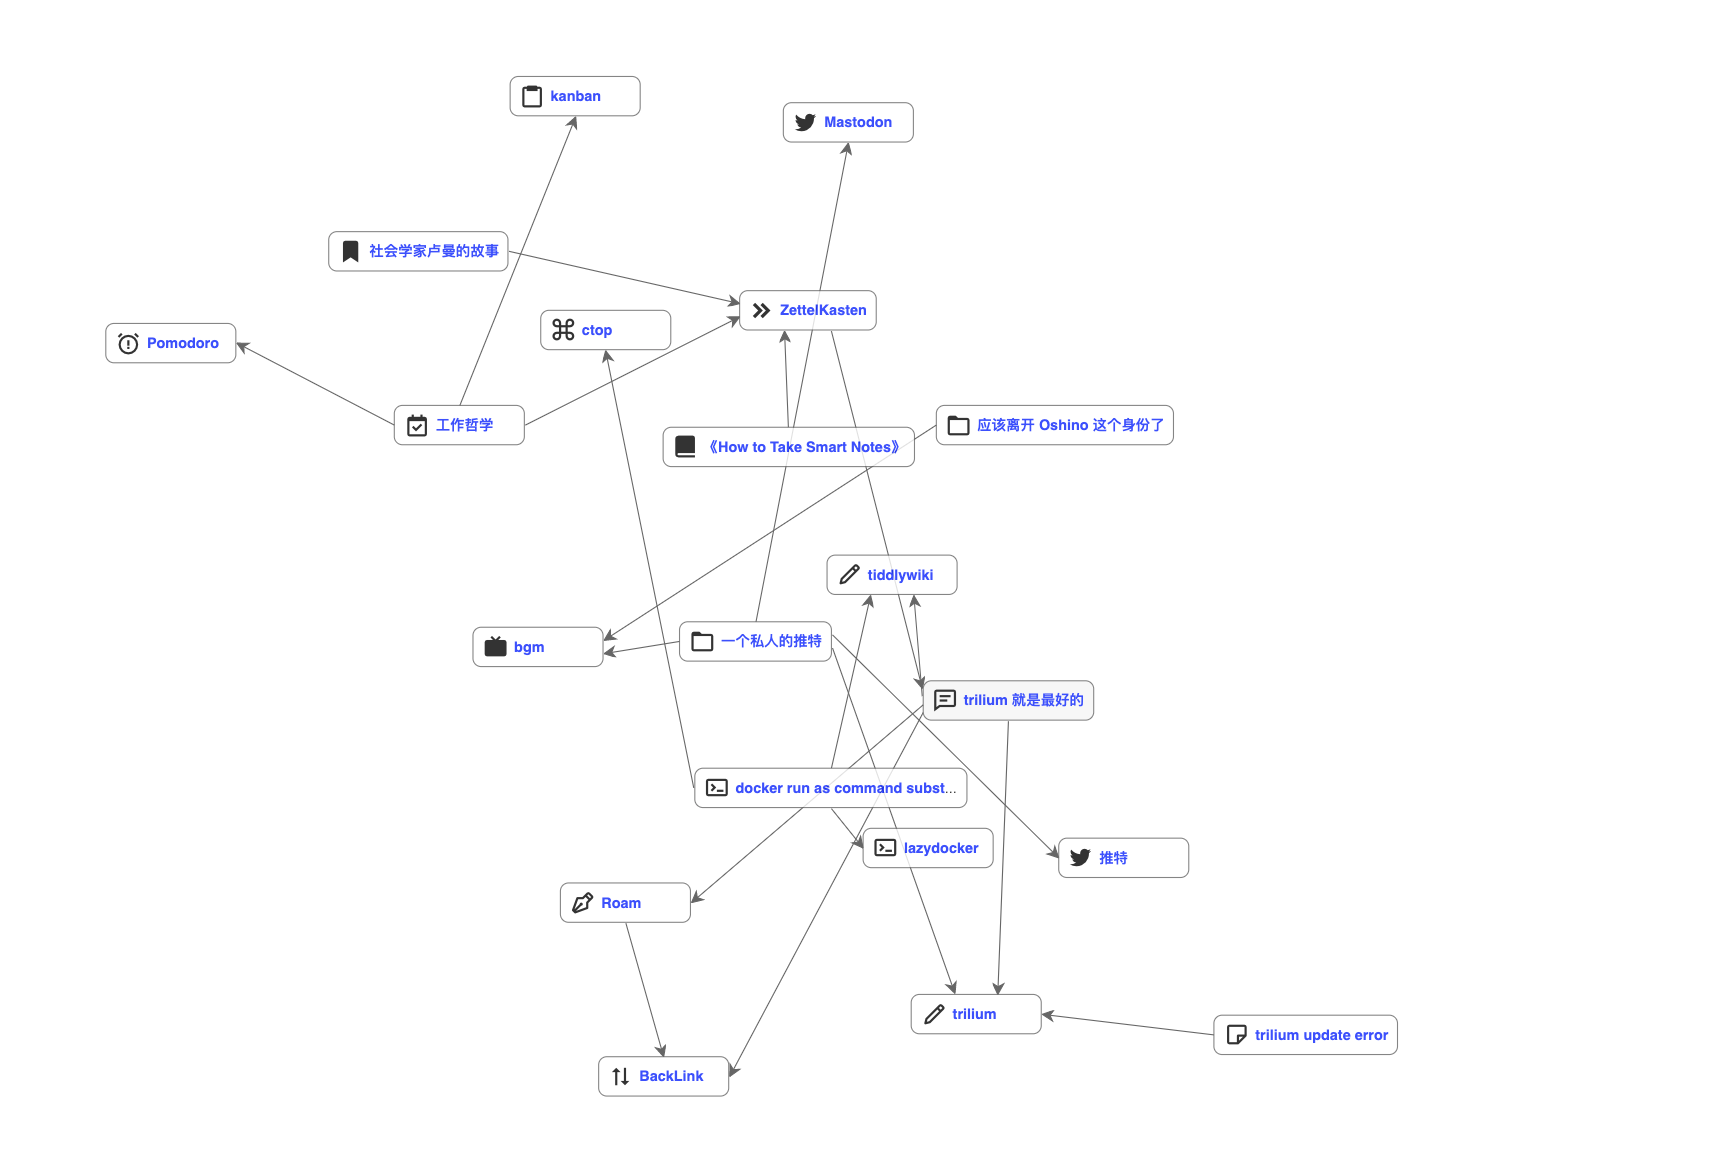
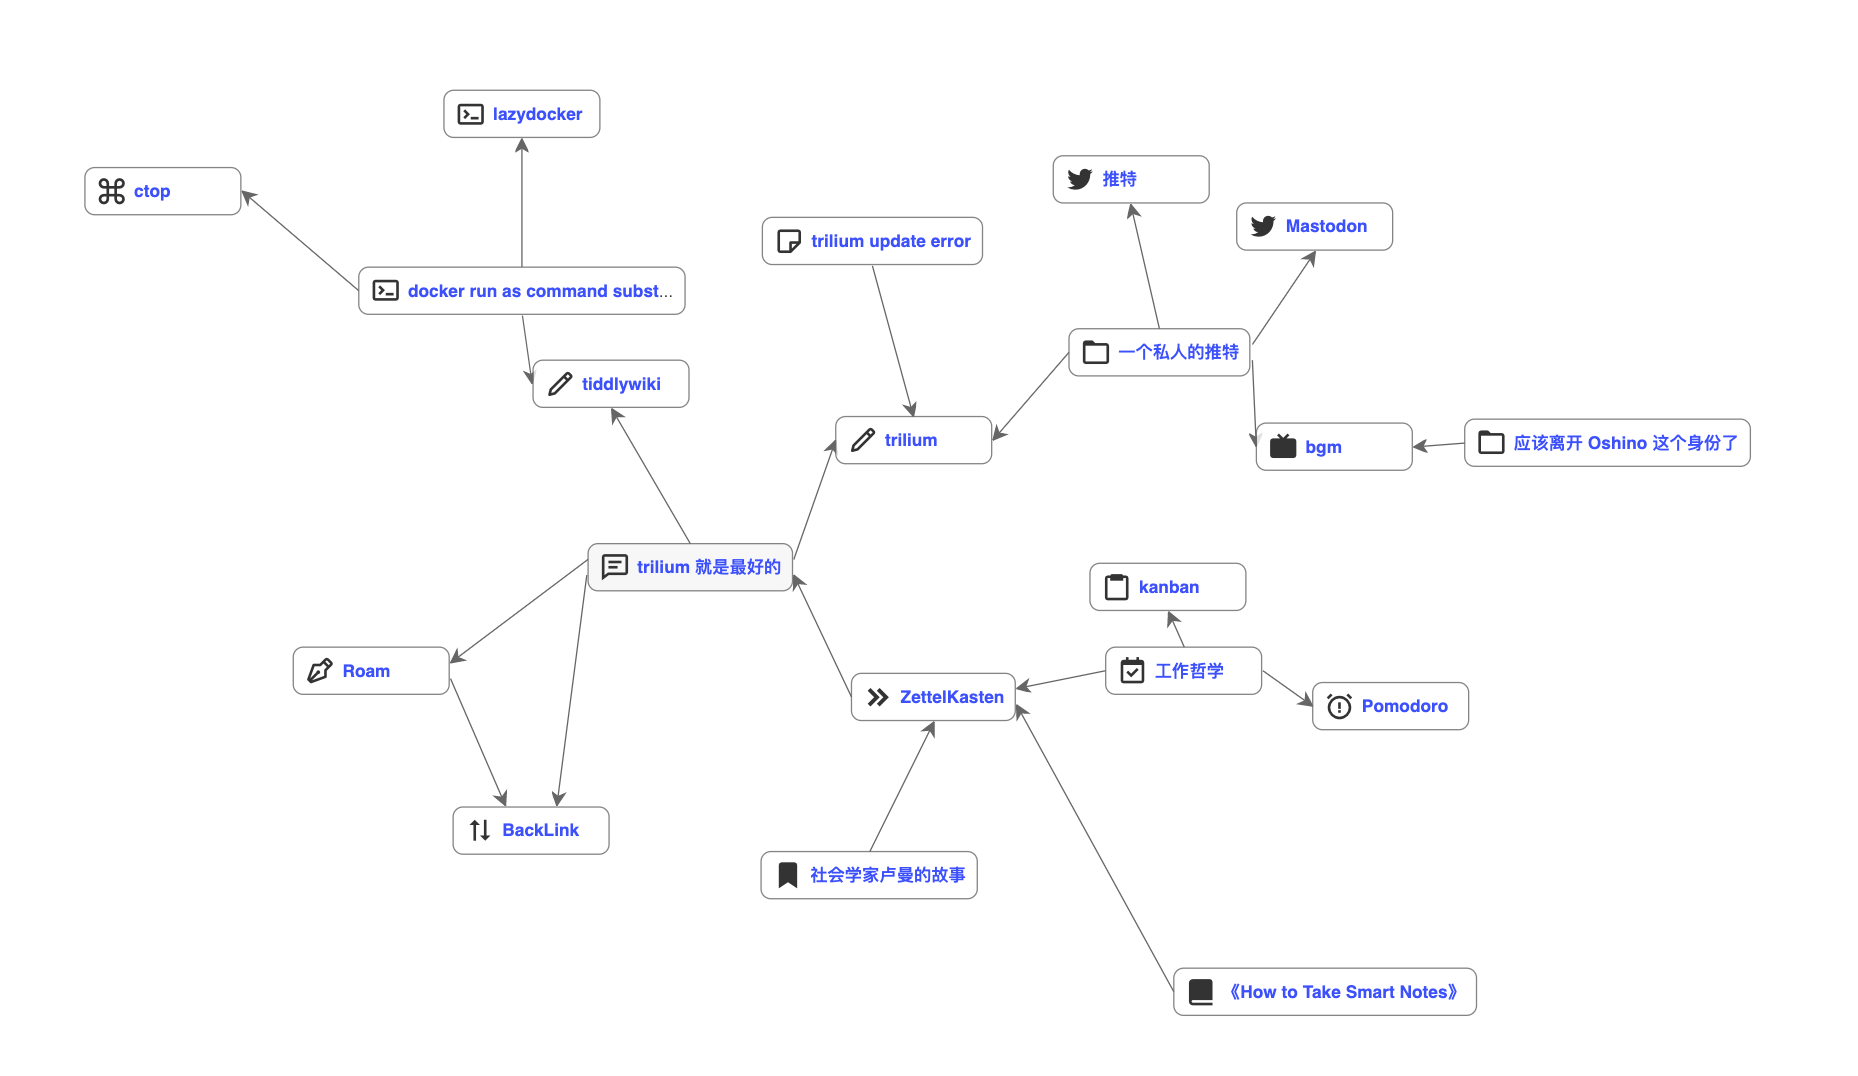
It will be a lot easier to underland the relations between notes if some algorithms can be employed to make the default layout more organized, like this(adjusted by hand):

zadam commented 2 years ago

For general graphs there isn't really a perfect algorithm for layouting. Trilium uses randomized force based layout algorithm which isn't perfect but again, there isn't really anything better (again for general oriented graph).

aaronshenhao commented 2 years ago

There are definitely existing libraries which can create a better graph layout. I found one called AlgorithmX (Javascript and Python, MIT license). I entered OP's graph (code, demo page) and this was the output:

image

This is the first time I used it so I don't know how to style properly. The force layout seems poorer if the nodes are very wide. However, I'm sure someone more experienced can solve the issue. There are probably tons of other graph libraries out there. This is just to prove that there is much room for improvement, and it can be done relatively easily using existing libraries.

It doesn't look as good when nodes are wide (repulsion from wider nodes probably needs to be larger) (code):

image

Larger repulsion forces would mean longer edges, which is equivalent to smaller nodes (proof of concept, code):

image

zadam commented 2 years ago

@aaronshenhao what you demonstrated is that this library is better at this particular graph. It's not clear if this holds for all other graphs as well.

It seems that this library uses constraint based layout. As I understand, this algorithm scales much worse than the force based one and is more suitable for graphs under 100 elements. My target number is much larger, in fact in the near future I plan to allow visualization of all the notes (up to 100 000).

aaronshenhao commented 2 years ago

Thanks for the reply. I don't think that library scales well for large graphs. For very large graphs I've had to use Gephi (Java), but I've never tried using it as a library.

Here's a graph with 12K nodes and 16K edges of a subset of Wikipedia's category graph (starting from the news-websites category). If you need real test data, I have a json file of Wikipedia's full category graph which has 2M nodes. The graph below uses the Yifan Hu algorithm, but sometimes other algorithms (or different settings) may produce a better looking graph. It takes quite a while for it to finalize the layout.

image image

The Force Atlas 2 algorithm produces a much denser graph which is almost impossible to read (need to tweak settings): image image

At such sizes, edges seem less useful to visualize. It's hard to trace where an edge goes. I'm not sure if would be useful to visualize such a large graph, although it is definitely cool 😛! Perhaps something like UMAP/tSNE may be more useful for visualization (closely related nodes are spatially closer; no edges). UMAP visualization of Math StackExchange tags (much better looking than graph with edges):

image image

aaronshenhao commented 2 years ago

Also, perhaps different libraries or approaches could be used for different graph sizes. Smaller graphs should have more functionality and can afford to have better layouts (since they represent the current area of focus; most work probably happens here). Larger graphs may have to sacrifice functionality, omit unnecessary nodes, use different layout algorithms or even visualization techniques.

zadam commented 2 years ago

Actually I've used large graphs with many thousands of elements successfully (on a different project) - it can give you some insights, seeing some patterns or large scale structure, or e.g. hint at the fact that most of your notes are not that much linked :-)

Also, perhaps different libraries or approaches could be used for different graph sizes.

That's an option but of course that also means more development and maintenance work. It's the best to find something which works acceptably for any input.

Yesterday I forgot to mention that the upcoming 0.48 actually changes the library to render the link maps (still force based). They have demo with 75 000 nodes which works surprisingly well (tested on chrome).

aaronshenhao commented 2 years ago

Yesterday I forgot to mention that the upcoming 0.48 actually changes the library to render the link maps (still force based). They have demo with 75 000 nodes which works surprisingly well (tested on chrome).

Wow, that's blazingly fast! The other examples on the project page looked great. The graph layout it produces seems just as good as the first library I used, and it's able to handle much larger graphs. It's interactive and has animations too. Seems like a double-win! I also noticed there's a 3D version of the library.

2D 0CC4D75A-509E-40EC-A3C3-C3C03C50B14B

3D 9D6074AB-1E71-48A6-8302-D33A09F70E36