 chrisseaton
commented
4 years ago
chrisseaton
commented
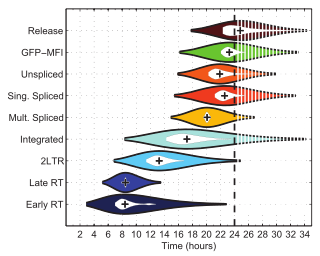
4 years ago Have you looked at things like violin plots? Effectively sort of a little histogram shown around the range, quartiles, means and things

Closed schneems closed 4 years ago
chrisseaton
commented
4 years ago Have you looked at things like violin plots? Effectively sort of a little histogram shown around the range, quartiles, means and things
 schneems
commented
4 years ago
schneems
commented
4 years ago Have you looked at things like violin plots
That rings a bell, but not recently. Sounds like it's worth it for me to reintroduce myself. Do you have any favorite resources on the topic?
For adding data visualizations to derailed:
One of the hard requirements for this project is to be able to represent data in a text format so that data summaries can be shared and compared without having to also provide the raw data. if I end up doing something that isn't ASCII based then I'll also need a way to simplify storing and sharing the image.
chrisseaton
commented
4 years ago https://chartio.com/learn/charts/violin-plot-complete-guide/ is good.
One of the hard requirements for this project is to be able to represent data in a text format so that data summaries can be shared and compared without having to also provide the raw data.
SVG so it's still just ASCII, even if you can't show it in the terminal. You can embed it in Markdown and anyone anywhere can render that, include it in readmes, PRs like this, issues, discussions, etc.
schneems
commented
4 years ago To comment back on what i've found from violin plots, my first impression when shown only one plotted made it seem like a two sided histogram. In reality you would plot mulitple on the same chart similar to how you would a "box plot" but the violin plot also includes information about distribution in addition to min/max/median.
You can also do a violin plot where one distribution is on one side of the line and the other is on the other side:

I think this is more compact, but perhaps a bit more confusing.
I think going forwards I can look into a way to generate an image and store it in the directory but I still want to also provide an output that can be copied/pasted directly from the terminal.
Short term: Ship this Medium term: Add support for generating histograms with similar axis (ideally side-by-side~).
I did consider showing plotting both in the same view similar to how google sheets does this but when you copy and paste from the command line you lose color information so that wouldn't be very useful
Longer term (Of if someone wanted to send me a PR): In addition to generating histograms also generate other data visualizations. Violin plots are on the top of that list.
schneems
commented
4 years ago I think that the different scales in the histograms will cause confusion rather than add clarity
                  Histogram - [sha1] "I am the new commit"
                                 ┌                                        ┐
                  [11.2 , 11.25) ┤▇▇▇▇▇▇▇▇▇▇▇▇▇▇ 8
                  [11.25, 11.3 ) ┤▇▇▇▇▇▇▇▇▇▇▇▇▇▇▇▇▇▇▇▇▇▇▇▇ 14
                  [11.3 , 11.35) ┤▇▇▇▇▇▇▇▇▇▇▇▇▇▇▇▇▇▇▇▇▇ 12
                  [11.35, 11.4 ) ┤▇▇▇▇▇▇▇▇▇▇▇▇▇▇▇▇▇▇▇▇▇▇▇▇▇▇▇▇▇▇▇▇▇▇▇▇ 21
   Time (seconds) [11.4 , 11.45) ┤▇▇▇▇▇▇▇▇▇▇▇▇▇▇▇▇▇▇▇▇▇▇▇▇▇▇▇ 16
                  [11.45, 11.5 ) ┤▇▇▇▇▇▇▇▇▇▇▇▇▇▇▇▇▇ 10
                  [11.5 , 11.55) ┤▇▇▇▇▇▇▇▇▇▇▇▇▇▇▇ 9
                  [11.55, 11.6 ) ┤▇▇▇▇▇▇▇▇▇▇ 6
                  [11.6 , 11.65) ┤▇▇▇▇▇▇▇ 4
                                 └                                        ┘
                                            # of runs in range

                  Histogram - [sha2] "Old commit"
                               ┌                                        ┐
                  [11.2, 11.3) ┤▇▇▇▇▇▇ 5
                  [11.3, 11.4) ┤▇▇▇▇▇▇▇▇▇▇▇▇▇▇▇▇▇▇▇▇▇▇▇▇▇▇▇▇▇▇ 27
                  [11.4, 11.5) ┤▇▇▇▇▇▇▇▇▇▇▇▇▇▇▇▇▇▇▇▇▇▇▇▇▇▇▇▇▇▇▇▇▇▇▇▇ 32
   Time (seconds) [11.5, 11.6) ┤▇▇▇▇▇▇▇▇▇▇▇▇▇▇▇▇▇▇▇▇▇▇▇▇ 21
                  [11.6, 11.7) ┤▇▇▇▇▇▇▇▇▇▇▇ 10
                  [11.7, 11.8) ┤▇▇▇ 3
                  [11.8, 11.9) ┤▇▇ 2
                               └                                        ┘
                                          # of runs in range
In this output the first commit is the "winner" but glancing at the shape of the histogram it looks like the median is lower for the second run. This is due to it having more bins than the second commit.
schneems
commented
4 years ago I made a gem mini_histogram that has a method that allows standardizing the edges of histograms. When I use it, I get a much better result:
                  Histogram - [winner] "I am the new commit"
                           ┌                                        ┐
            [11.2 , 11.28) ┤▇▇▇▇▇▇▇▇▇▇▇▇▇▇ 12
            [11.28, 11.36) ┤▇▇▇▇▇▇▇▇▇▇▇▇▇▇▇▇▇▇▇▇▇▇▇▇▇▇ 22
            [11.35, 11.43) ┤▇▇▇▇▇▇▇▇▇▇▇▇▇▇▇▇▇▇▇▇▇▇▇▇▇▇▇▇▇▇▇▇▇▇▇▇ 30
            [11.43, 11.51) ┤▇▇▇▇▇▇▇▇▇▇▇▇▇▇▇▇▇▇▇▇ 17
   Time (s) [11.5 , 11.58) ┤▇▇▇▇▇▇▇▇▇▇▇▇▇▇▇▇ 13
            [11.58, 11.66) ┤▇▇▇▇▇▇▇ 6
            [11.65, 11.73) ┤ 0
            [11.73, 11.81) ┤ 0
            [11.8 , 11.88) ┤ 0
                           └                                        ┘
                                      # of runs in range

                  Histogram - [loser] "Old commit"
                           ┌                                        ┐
            [11.2 , 11.28) ┤▇▇▇▇ 3
            [11.28, 11.36) ┤▇▇▇▇▇▇▇▇▇▇▇▇▇▇▇▇▇▇▇▇▇▇▇▇▇▇▇ 19
            [11.35, 11.43) ┤▇▇▇▇▇▇▇▇▇▇▇▇▇▇▇▇▇▇▇▇▇▇▇▇ 17
            [11.43, 11.51) ┤▇▇▇▇▇▇▇▇▇▇▇▇▇▇▇▇▇▇▇▇▇▇▇▇▇▇▇▇▇▇▇▇▇▇▇▇ 25
   Time (s) [11.5 , 11.58) ┤▇▇▇▇▇▇▇▇▇▇▇▇▇▇▇▇▇▇▇▇▇▇ 15
            [11.58, 11.66) ┤▇▇▇▇▇▇▇▇▇▇▇▇▇▇▇▇▇▇▇ 13
            [11.65, 11.73) ┤▇▇▇▇ 3
            [11.73, 11.81) ┤▇▇▇▇ 3
            [11.8 , 11.88) ┤▇▇▇ 2
                           └                                        ┘
                                      # of runs in range
Now it's quite clear that the top one has a median that is lower than the bottom value.
It does look like the X-axis isn't scaled consistently, which is a negative but I think it's not a deal breaker. Essentially these two values on different graphs shouldn't align perfectly but they do:
            [11.35, 11.43) ┤▇▇▇▇▇▇▇▇▇▇▇▇▇▇▇▇▇▇▇▇▇▇▇▇▇▇▇▇▇▇▇▇▇▇▇▇ 30
            [11.43, 11.51) ┤▇▇▇▇▇▇▇▇▇▇▇▇▇▇▇▇▇▇▇▇▇▇▇▇▇▇▇▇▇▇▇▇▇▇▇▇ 25
I've honestly spent more time and brainpower on this than is reasonable. I think it's good enough to ship. I am going to add some edge checks to mini_histogram (does it work if I only pass in 2 values? what about 1 value? etc.) After that I think we can :shipit:
Turns out that reducing a whole bunch of numbers to a single value (average for example, or median) means that we're getting rid of a huge amount of information. One way to add context back in without drowning users in raw data is to include a histogram in the output.
With histograms in the output the user can see the distributions of their two runs to make better informed decisions about the validity of the data.
Here's an example histogram:
Here's how the output looks in a test run:
Caveats
The histograms that are presented do not have identical/correct axis. So while the shape of the histograms are correct in comparison to each other, you cannot place them side by side for an accurate representation because they have different bin sizes and start from a different value.
In the short term I do think that the visual data being present with this caveat is better than nothing. In the long term support would need to be added to
unicode_plotto support this behavior.Blockers
There is a bug that raises an error when 2 values are given to generate a histogram if the values have some special undetermined relationship. This is tracked here:
https://github.com/red-data-tools/unicode_plot.rb/issues/24